History and Records of the Automatic Weather Station on Denali Pass Part II: The Data
- By Dr. Lea Hartl
- Jul 31, 2023
Photo by Tohru Saito
This is Part II of the series by Dr. Lea Hartl discussing the history and data records of the automatic weather station on Denali Pass. If you missed Part I, follow this link.
The records and construction of the Automatic Weather Station (AWS) on Denali
Temperature
Standard platinum thermistors were used to record temperature at various heights on the instrument stand and in the logger box. Unfortunately, standard radiation shielding was not used and several degrees of uncertainty must be assumed for the temperature time series. With the aim of providing consolidated time series of temperature from the Denali Pass AWS, we focus on the temperature record from the data logger box and air temperature as recorded by sensors on the mast, using the highest sensor on the mast depending on data availability. For more details on data cleaning and processing please refer to Hartl et al. 2020b.
Keeping in mind the high uncertainty, the lowest temperatures recorded at the Denali Pass weather station reached approximately -60°C and during a several-day cold snap in late November/early December 2003. Diurnal temperature amplitudes are highest in late spring and summer, reaching mean values of 8ºC to 10°C during the main climbing season (April-July), and lowest in the winter months with about 5°C. June, July, and August are the warmest months, with mean temperatures above -20°C. From December to March, monthly mean temperatures are relatively constant at about -38°C. The measured temperatures and ERA5 reanalysis data are highly correlated, with Pearson correlation coefficients of daily mean temperatures of around 0.9 for all seasons (daily mean temperature from the AWS was compared to reanalysis for yearly intervals from June 1 to May 31st of the following year). The reanalysis data tend to overestimate temperatures in the winter, from about October to April, and match the measured values more closely in summer. We applied a simple linear regression to the AWS data (excluding the years in which the temperature sensors were housed in a plastic bottle) and corresponding reanalysis values to generate a corrected reanalysis time series that accounts for this overestimation of low temperatures. The discrepancy between reanalysis and AWS data for low temperatures may result from ground level radiative cooling that is not resolved in the 500hPa reanalysis data, but more data (in-situ radiation measurements) would be required to determine this with certainty.
Wind
Wind speed is available from a RM Young 05103 anemometer from summer 1994 into 1996. This instrument had disappeared from the stand when the maintenance expedition arrived in June 1996. The only other instrument to successfully collect useable wind data (wind speed and direction) was a Vaisala WS425 A1 ultrasonic anemometer, which was operational from summer 2003 until spring 2004. Many other anemometers were installed over the years and either proved unsuitable (not calibrated for high enough wind speeds) or were mechanically destroyed by the harsh conditions.
Both the RM Young and Vailasa instruments recorded momentary wind speed at 30-minute intervals, as opposed to 30-minute average wind speed. For the RM Young anemometer, the exact scan interval at which the instrument sampled is unknown as the logger code was not preserved. Documentation indicates that wind speed was sampled for a brief interval of a few seconds - likely a value between 1 and 10 seconds. The Vaisala anemometer took 3-second samples recorded every 30 minutes. This approach was chosen in order to preserve battery life and in hopes of recording extreme gusts rather than average wind speeds.
Since wind speed was sampled rather than averaged, statistical interpretation and comparison with hourly mean reanalysis wind speed is complex. Qualitatively speaking, peaks in the measured wind speed do tend to coincide with peaks in the reanalysis, particularly during the 2004 spring season, and the range of magnitude found in the reanalysis data is comparable to that of the measured values.
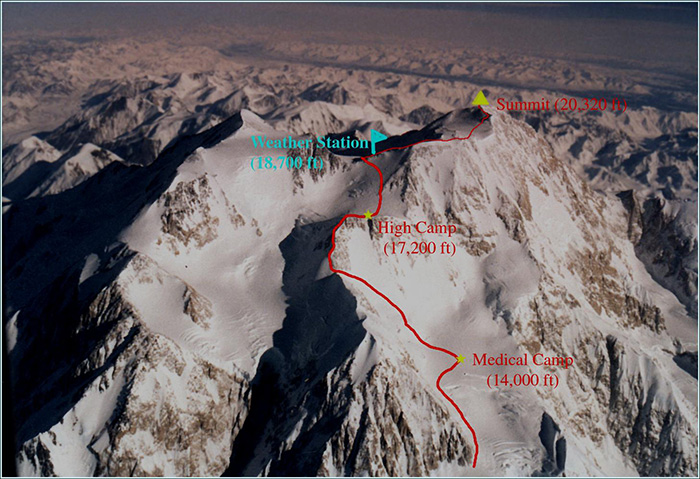
Wind direction as recorded during the 2003-2004 season by the Vaisala instrument shows that the wind primarily blows from the West or East on Denali Pass. In contrast, reanalysis data indicate that the dominant wind direction in the free atmosphere at 500hPa is broadly southerly, with seasonal shifts from SW to SE (Hartl et al., 2020a). Given the location of the AWS on a pronounced, West-East oriented saddle between higher terrain to the North and South, topography can be expected to strongly affect local wind speed and direction. Although there is some uncertainty associated with these data (e.g. due to unknown amounts of turbulence around the tripod stand), the dominance of West and East wind in the AWS records supports the idea that the pass acts as a wind funnel.

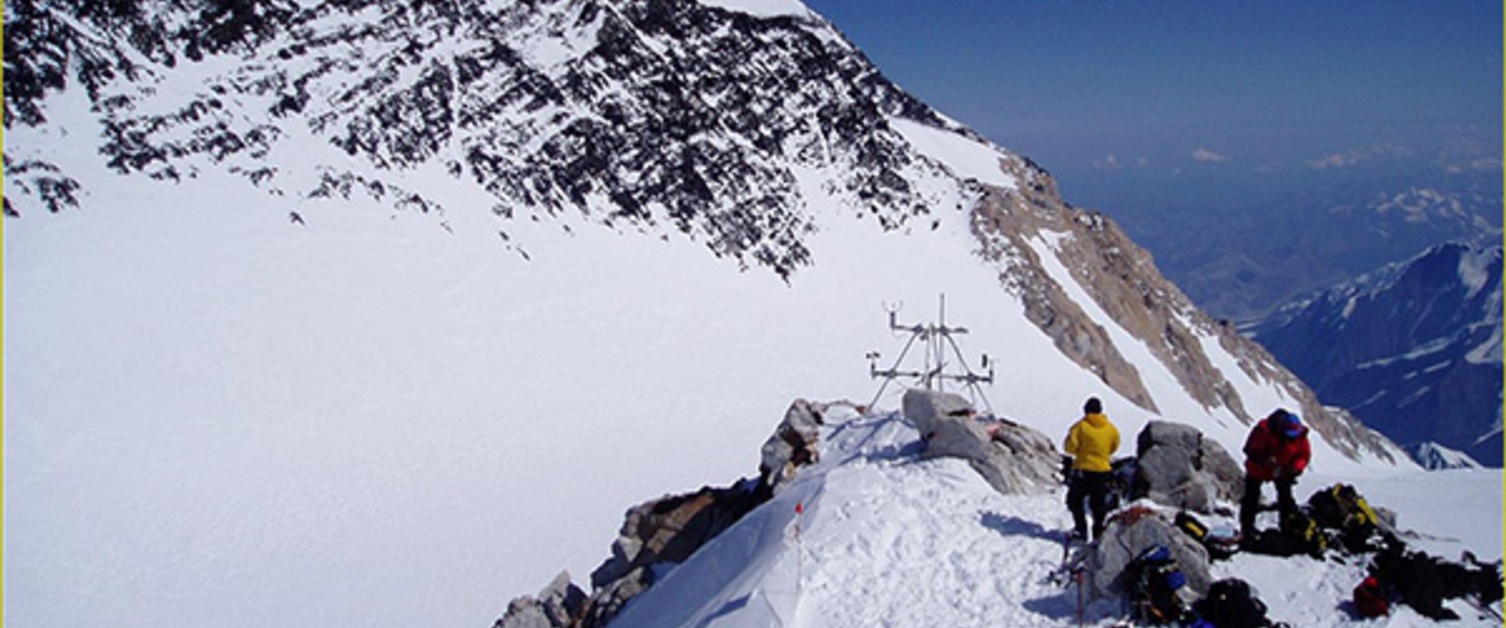
Image by Tohru Saito
A note on processing
Data files were initially stored as Lotus 1-2-3 (Lotus Software) spreadsheets, which were converted to CSV format for the purpose of this publication. Processing these files posed a number of challenges: Neither the individual data loggers nor the logger channels were used consistently for the same output parameters throughout the years and there is limited documentation of respective changes, as well as on the meaning of parameter abbreviations in the files. Additionally, three different time zones (Alaska local time, Japanese local time, UTC) were used for logger timestamps over the years. Time zone information was documented in some years, but not in others. We homogenized the timestamps to UTC based on comparisons of average diurnal temperature cycles for seasons with known time zones and seasons with unknown time zones, i.e. by inferring the time zone from the timing of the solar driven diurnal temperature cycle.
Final remarks
Yoshitomi Okura's goal was to prove that the summit region of Denali is subject to extreme wind speeds that can endanger climbers and he certainly achieved this goal with Denali Pass AWS project: Wind speeds in excess of 60m/s were recorded at Denali Pass. People may be blown off their feet by significantly less extreme winds. Okura remains convinced that gale force winds were a main contributing factor in the fatal accident of his climbing partners. Since the end of the Denali Pass weather station project, significant technological advancements have been made and a weather station with real time data in the upper elevations of Denali would improve the safety of climbers, aid NPS operations, and could be used to verify and improve local weather forecasts.
It would be key to integrate any new station in the summit region of Denali into the NPS network, not least for practical reasons (logistics, air support). In their report on the recently installed AWS network on Mt. Everest, Matthews et al. (2020) note that support from the local climbing community is critical to ensure the longevity and continued maintenance of the stations. On Denali, collaboration with the NPS – which manages the climbing activity on the mountain – is crucial for the same reasons.
On a more general note, the Denali Pass AWS project serves to highlight the importance of systematic meta-data documentation and data management based on file formats that are cross-platform compatible and not dependent on proprietary software that may become obsolete in the future.
These issues notwithstanding, the Denali Pass AWS also exemplifies that the initiative of one or several individuals can lead to significant achievements in terms of meteorological data collection and the great value of citizen science. For several years, the Denali Pass AWS was the highest weather station in the Americas and to this day there are very few continuous records from higher elevations. This hugely significant achievement cannot be overstated.
Data Availability
The processed temperature time series, wind data for the 1994-1996 and 2003-2004 periods, and pressure data for 2003-2004 are available for download at the data repository pangaea.de (Hartl et al. 2020b).
References
Hartl, L.; Stuefer, M. & Saito, T. (2020a). The Mountain Weather and Climate of Denali, Alaska—An Overview. Journal of Applied Meteorology and Climatology, 59(4), 621-636.
Hartl, L.; Stuefer, M.; Saito, T.; Okura, Y. (2020b). Meteorological Observations at Denali Pass Automatic Weather Station, Alaska, USA,1990-2007. PANGAEA, https://doi.org/10.1594/PANGAEA.922805
Matthews, T., Perry, L.B., Koch, I., Aryal, D., Khadka, A., Shrestha, D., Abernathy, K., Elmore, A.C., Seimon, A., Tait, A. and Elvin, S., (2020). Going to Extremes: Installing the World’s Highest Weather Stations on Mount Everest. Bulletin of the American Meteorological Society.
This article has been written and adapted specifically for the AMS Weather Band. Copyright remains with the AMS.
