How Ancient Greece Created Our Climate Zones
- story map
- By AMS Staff
- Aug 4, 2021
What do we plant? What do we wear? What weather hazards do we prepare for?
Climate classifications make it easier to provide answers to all of those questions. As a framework for identifying the general weather patterns and climate characteristics of a region, classifications are not just for researchers. They also create a shorthand that helps take effort out of day to day activities, long term planning, and travel and vacation plans.
Classifications are also of intense interest now as they are shifted and altered by the impacts of climate change. But what underlies these distinctions, and where do they come from? Let's take a look at the origins of the Köppen-Geiger climate classification, one of the most commonly used frameworks.
The concept of a spherical world is attributed to the Greek philosopher Pythagoras in the sixth century B.C. His disciple Parmenides stipulated five zones on the surface of this spherical world (one torrid, two temperate, and two frigid) and stated that the central torrid zone was uninhabitable because of the heat from the direct rays of the sun (Harley and Woodward 1987). Not all Greek intellectuals held this belief. Herodotus in the fifth century B.C. maintained that the earth was flat, and because of this it was hotter in India in the morning, when the sun was closer to the earth, than it was at noon (Bagrow 1964).
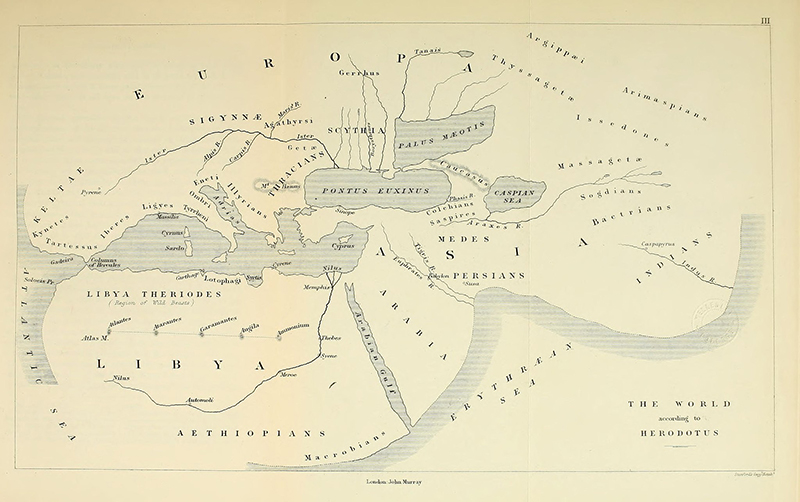
Herodotus' conception of the world from Bunbury's "A history of ancient geography among the Greeks and Romans, from the earliest ages till the fall of the Roman Empire"
In the fourth century B.C., the Greek philosopher Aristotle (384-322 B.C.) reviewed the opinions of earlier philosophers about the earth. He agreed with Parmenides that the earth was a sphere in the center of the universe, that there were five zones, and that the habitable world was confined to the temperate zone between the Tropics and the northern frigid zone (Lee 1962). He suggested that the western half of the temperate zone on the other side of the world from Greece might be habitable and that, because of symmetry, there must be in the Southern Hemisphere a temperate zone corresponding to that in the northern. He believed, however, that the excessive heat in the torrid zone would prevent the exploration of this southern zone (Harley and Woodward 1987).
Although Anaximander in the fifth century B.C. had invented the gnomon or sundial, permitting the measurement of the sun's altitude and therefore the latitude of a place, there were few such scientific measurements available to the early theorists. There had been voyages to the west coast of Africa by the Carthaginian explorer Hanno (470 B.C.), England by Himilco (mid-fifth century B.C.), to the North Sea by Pytheas (330 B.C.), and to the east by Alexander the Great (350 B.C.). Pytheas was the first to suggest that "length of longest day" could be the criterion determining the limits of the various climates, but like many modern expeditions, data capture was a problem. The Greek geographers lamented the failure of the explorers to take scientific measurements such as the altitude of the sun or the length of the longest day. 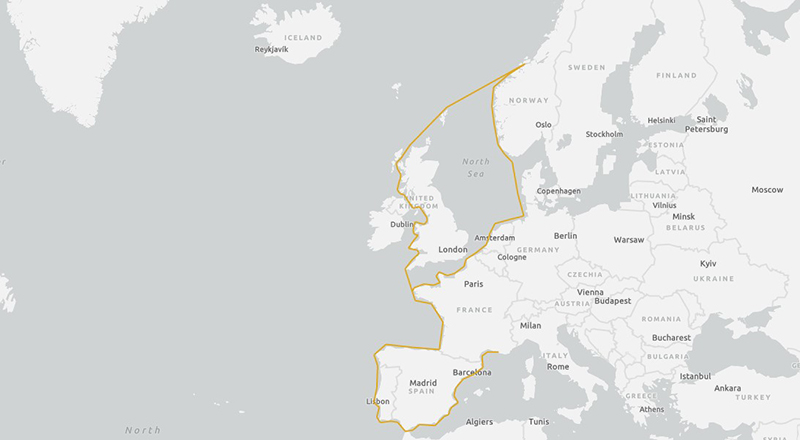
The exact route taken by Pytheas (330 B.C.) is still debated - he references frozen seas and pancake ice, but his identification of the land of Thule in the far north have been variously claimed to be Iceland or Norway. The orange line marks one possible route for his voyage.
Erastosthenes (275-194 B.C.) was a scientific geographer whose great contribution was the accurate estimation of the circumference of the world (25,000 miles) based on the distance between Syene and Alexandria in Egypt, and the geometry of the sphere. He also wished to delimit the habitable world, which he believed to be surrounded by a world ocean, and set down specific dimensions for the habitable world: 7800 miles from west to east and 3800 miles south to north. He divided his habitable world by lines drawn parallel to the equator through familiar places such as Alexandria or Rhodes, rather than making them equidistant from each other (Brown 1949).
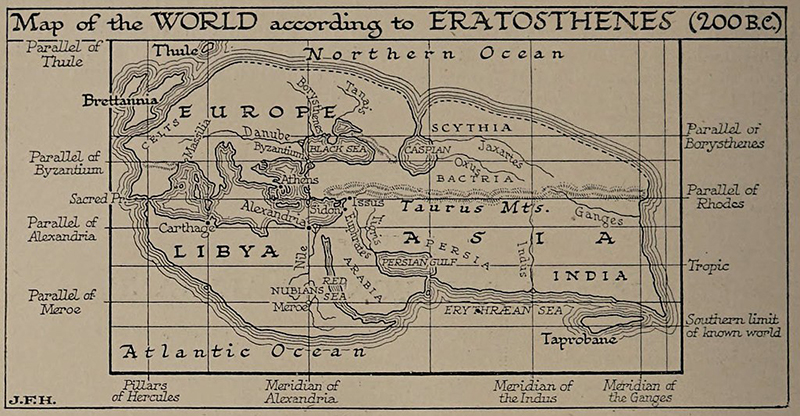
Map of the world according to Eratosthenes from H.G. Wells' Outline of History
In 140 B.C., the astronomer Hipparchus attempted to correct Eratosthenes's map in an article entitled "Against Eratosthenes," stating that it was impossible to locate exactly any place on the earth without astronomical observations. He took the principal parallel of Eratosthenes (through Alexandria) as the basis for his division of the known world and was the first to apply the term "climata" to the regions between these equidistant lines. He stated that countries lying beyond the clima with a longest day of 17 hours were uninhabitable on account of the cold and, thus, were of no interest (Bagrow 1964).
It is from the philosopher-traveler Strabo (63 B.C- 23 A.D.) that we obtain most of our information about ancient cartography (Brown 1949). He quoted Poseidonius (135-51 B.C.) as saying that there were seven zones on the earth's surface, including two "super torrid" zones on either side of the equator where the land was thoroughly parched and uninhabitable.
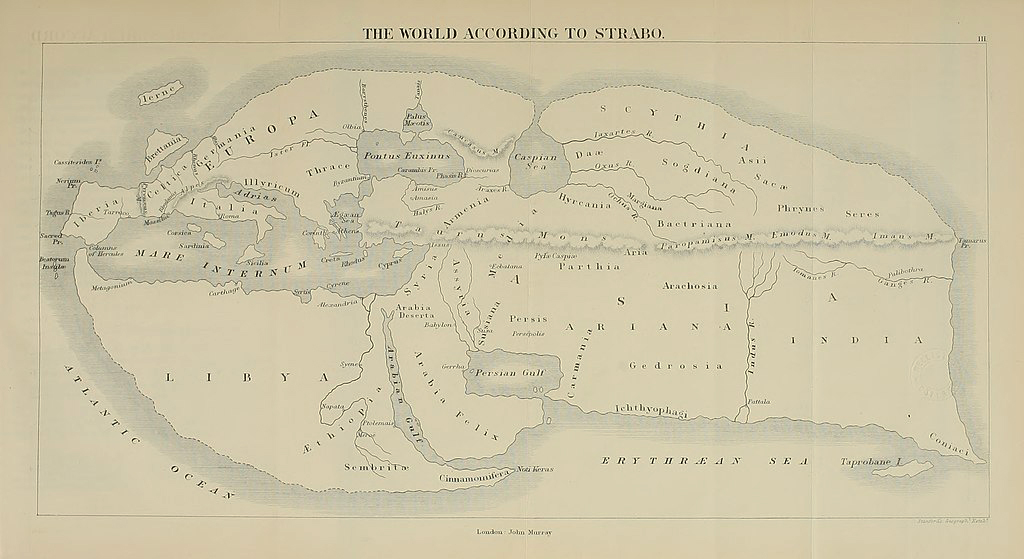
Strabo's map of the world from Bunbury's "A history of ancient geography among the Greeks and Romans, from the earliest ages till the fall of the Roman Empire"
Strabo accepted the five zones of Pythagoras rather than Poseidonius's seven since he believed that symmetry was a tool of geographic research. Strabo used the term "torrid" to mean a region so burnt up with heat as to be uninhabitable and argued that the term could not be applied to the whole region between the Tropics since the region from Syene in Egypt to the land of Cinnamon (Somaliland) was known to be inhabited. He said that India, being inhabited, could not lie in the torrid zone and, therefore, must lie in an east-west rather than a north-south direction. For this reason, for centuries India was oriented to the east on all maps.
Strabo also accepted Eratosthenes's idea of the existence of a habitable zone south of the equator but stated that there was no proof of it being habitable, and since the geographers' duty was to delimit the "known" world, it was not worth discussion. Strabo quoted many examples of the way in which men and crops were correlated with the climata, and his monumental treatise fixed for centuries in European thought the idea that the climata controlled the crops, temperature, even the physical characteristics of the people, rather than the astronomical lines they were intended to be.
The Roman geographers added little to the scientific ideas of the climata. Pomponius Mela in the first century A.D. wrote a brief description of the earth with five zones. His treatise is interesting chiefly because of his mention of "antichthones," people whom he believed inhabited the southern temperate zone, although like the earlier Greeks he believed that this zone was inaccessible because of the intervening torrid zone.
The celebrated Greek astronomer and mapmaker Ptolemy (87-150 A.D.) of Alexandria played a most important role in the renaissance of learning in fifteenth-century Europe. He stated that his aim was to reform the map of the world and base it on sound astronomical principles. He drew much of his material from Marinus of Tyre, although he did not hesitate to point out Marinus's errors, for example, that Marinus had not made the climata equidistant from one another. Ptolemy laid down 21 equidistant parallels between the equator and the parallel of Thule (which he identified with Greenland), and an additional parallel was added south of the equator. Ptolemy gave three legends to his maps, which marked the length of the longest day, the latitude in degrees, and climate number (these numbers were assigned based on the length of the day at the solstice). Ptolemy firmly believed that climate and latitude were synonymous and perpetuated the climata of earlier geographers, since his maps became the outstanding authority in renaissance Europe.
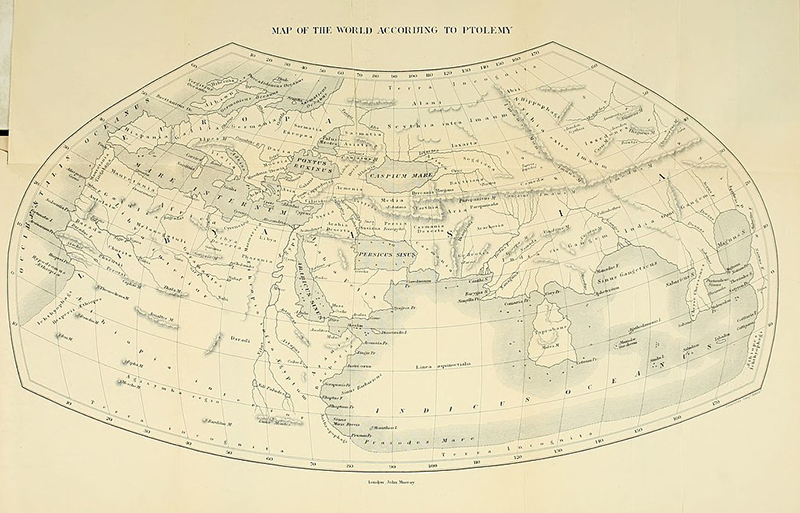
A map of Ptolemy's world from Bunbury's "A history of ancient geography among the Greeks and Romans, from the earliest ages till the fall of the Roman Empire"
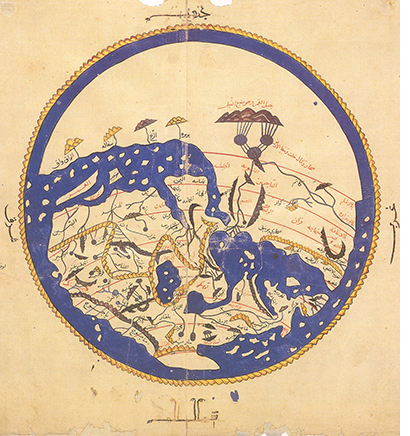 The Arab geographers, borrowing from the earlier Greeks and later from Ptolemy, also showed climata on their maps. The most famous of the Arab map makers, Idrisi, showed seven climata on his 1154 A.D. map (Bagrow 1964). This division into seven was significant to the Arab geographers, since seven was thought to be a magic number.
During the Middle Ages, most of the maps of the world were of the T-O type (the letter T within the letter O) showing a circular world divided into three continents (Asia, Europe, and Africa) and oriented to the east. There were a few exceptions to this type, that included climate zones, but they were few and usually included areas to the north and south labeled "uninhabitable" because of the cold or heat.
By the middle of the sixteenth century there were scientific methods of determining latitude by the height of the sun and by the polestar. Gradually, as such information became available, maps began to show degrees of latitude instead of lengths of the longest day. As the climata were replaced by latitude shown in degrees, many mapmakers, wishing to show some indication of climate on their maps, and having no climate classification, reverted to the original Greek theory of five zones: one torrid, two temperate, and two frigid. When maps of the new world appeared, mapmakers extrapolated these zones to the new territories. Homem's (1554) map and the Blaeu (1648) atlas show the latitudinally extrapolated "zona frigida," "zona temperata," and "zona torrida" on their maps of North and South America. The idea of limits to the habitable world also persisted for centuries. In his geography text, Malte-Brun (1834) stated "the 78th parallel of latitude seems to be the limit of the habitable world in the Northern Hemisphere."
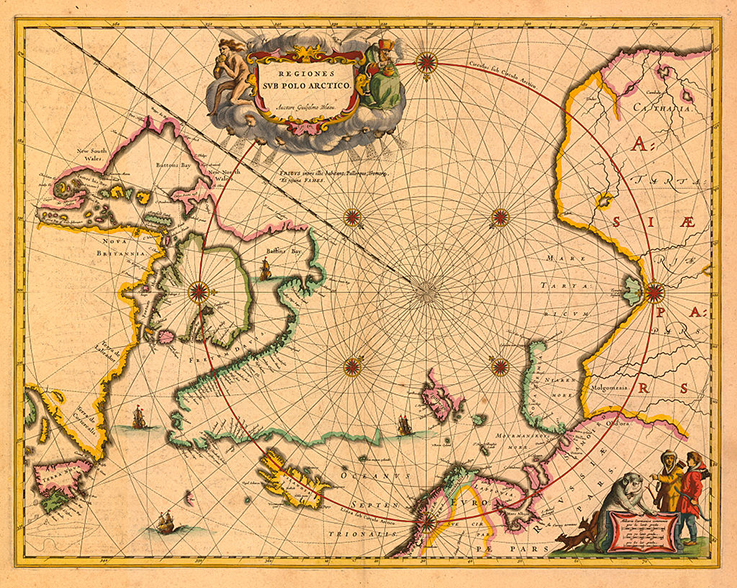
Willem Blaeu's 1638 map of the Arctic
The persistence of the Greek idea of latitudinal climatic zones seems amazing when the geographical explorations that began in the fifteenth century showed that the lands in the new world had climates that were not simple extrapolations of European climates, but highly irregular areas exhibiting contrasts in moisture supply as well as temperature. But the zonal system continued to be shown on maps because of a lack of quantitative climatic information. With the development of meteorological instruments such as the thermometer in the late eighteenth century in Europe, regular climatic observations began to be taken. The German botanist Dove (1853) published the first world maps of temperature and precipitation in 1848.
The first quantitative classification of world climates was made by the German scientist Wladimir Köppen in 1900. Köppen was trained as a plant physiologist and realized that plants could serve as synthesizers of the many climatic elements. He chose the five vegetation groups of the late nineteenth century French botanist De Candolle, which were still based on the climate zones of the Greeks as symbols for his classification: A, the plants of the torrid zone; C, the plants of the temperate zone; D and E, the plants of the frigid zone, while the B group represented plants of the dry zone. A second letter in the classification expressed the moisture factor (an Af climate is tropical and rainy).
.png)
Example of the Köppen-Geiger climate classifications applied across the globe. Created by Mauricio Lucioni
Throughout his long life Köppen attempted to fit various isolines of temperature to the vegetation boundaries of de Candolle. His famous "Handbuch de Klimatologie," published in 1936, brought his classification to the attention of world geographers. When English translations of his work were made, the English-speaking world eagerly adopted his numerical classification of climates, and maps of the climates of every continent using the Köppen classification began to appear (Mather and Sanderson 1996).
Although the American climatologist Thornthwaite (1899-1963) published a more rational classification of climate based on the relationship between potential evapotranspiration and precipitation (Thornthwaite 1948), it never became widely used. The reason probably lies in the less understood concept of "potential evapotranspiration" and the cumbersome four symbols used by Thornthwaite. Modern atlases and geography textbooks continue to use the 100-year old Köppen classification of climates, which was based on de Candolle's vegetation groups, themselves based on the five climatic zones of the ancient Greeks.
Work to update the climate zones has been accelerating with the increased impacts of climate change, but it is an open question as to whether this five zone system can accurately depict the intricacies of climates across the globe. Explore the links below to learn more about modern mapping of the climate zones:
New World Maps of Köppen-Geiger Climate Zones
Redrawing the Map: How the Climate Zones are Shifting (Yale Climate Connections)
New Climate Maps Show a Transformed United States
This article has been edited and adapted specifically for the AMS Weather Band from a longer article by Marie Sanderson published in the Bulletin of the American Meteorological Society. All errors and omissions may be attributed to AMS Staff. Copyright remains with the AMS.