The Texas-Minnesota MCV - Bow Echo
- By Ted Best and Ruth Milburn
- Nov 21, 2022
Introduction
The term “bow echo” refers to the appearance on a radar image (the echo) of a crescent (like an archery bow) moving outward from a squall line. Bow echoes are of interest to meteorologists because they indicate the potential for severe weather. Derechos (damaging straight line winds) and tornadoes are both associated with bow echoes.
A line of storms may form along the boundary between two air masses when the warm air is lifted over cooler air. When the storms are close together, they may look like a single long line of showers and thunderstorms. That line, which is moving at the speed with which one air mass is overtaking the other, is called a squall line. The line is usually linear, or only slightly curved and is sometimes referred to as a Quasi-Linear Convective System (QLCS.)
What causes a portion of the squall line to bulge out, outrunning the rest of the line and forming that characteristic bow image on radar? When variations in the air pressure aloft force a stream of air down behind the squall line (called a “rear inflow jet”) the stream of air forces that section of the line ahead.
A bow echo is sometimes seen in association with a mesoscale convective system (MCS). Mesoscale just means mid-range in size. Bigger than a single thunderstorm, smaller than a low pressure system, for example. Technically, convection doesn’t mean rain, it just means that the air is moving up and down in response to heat transfer, but even meteorologists tend to imply rain when they talk about convection– so a convective system usually means organized storminess and thunderstorms. For our discussion, the MCS is a collection of showers and thunderstorms that forms a contiguous precipitation area of at least 100 km in at least one direction.
In the early years of this century, National Oceanic and Atmospheric Administration (NOAA) in collaboration with the university research consortium National Center for Atmospheric Research performed an experiment that looked at Bow Echoes in MCSs. Called BAMEX, for Bow Echoes and Mesoscale Convective Vortices (MCV) Experiment, the experiment utilized ground and air-based Doppler radar, temperature soundings and other equipment in a coordinated field operation looking at eighteen long-lived MCSs. What is this Vortex they were looking for? Unlike the smaller spin ups that form at the edges of a squall line, it is a long lived mid-sized convective swirl produced within a large and persistent MCS. This kind of MCV can provide the focus for new convection, and sometimes is key to a linking of multi-day convective systems. The BAMEX experiment collected data on a good many MCVs during the experiment. Only two bow echoes were observed in detail.
BAMEX created a dense dataset of many variables (one airplane even collected ice pellets using a probe) that has served researchers who study the MCS. Follow on experiments were able to use BAMEX as proof that a high level of coordination among multiple data collection systems could be accomplished in real time.
In this work, we document the evolution of a bow echo MCS across southern Minnesota on the 11 May 2022. An MCV that travelled across the central plains from the Texas panhandle played a key in its initiation. The MCS and bow echo left a trail of severe weather across south central Minnesota.
Environmental Conditions
Both upper level and surface features played an important role in this event. A 500 mb trough over the western US provided southwesterly flow over the central plains. This flow pattern played a key role in the movement of an MCV that formed over the Texas panhandle early on May 11.

The 0000 UTC May 12 (7:00 PM CDT) Minneapolis sounding from UCAR shows directional shear and ample instability for strong storms. The NOAA Storm Prediction Center (SPC) contour image on the right shows the instability – Convective Available Potential Energy (CAPE) - at least 2500 J/kg over much of south-central Minnesota at 2300 UTC (6:00 PM CDT.)

Courtesy of UCAR (http://weather.rap.ucar.edu/upper/)

Courtesy of the NOAA Storm Prediction Center
There was also ample low-level moisture in place for storms and heavy rain as shown below by the Precipitable Water (PWTR) values in the lowest layer of the atmosphere (lowest 400 mb.)
Courtesy of the NOAA Storm Prediction Center
Initiation and Evolution
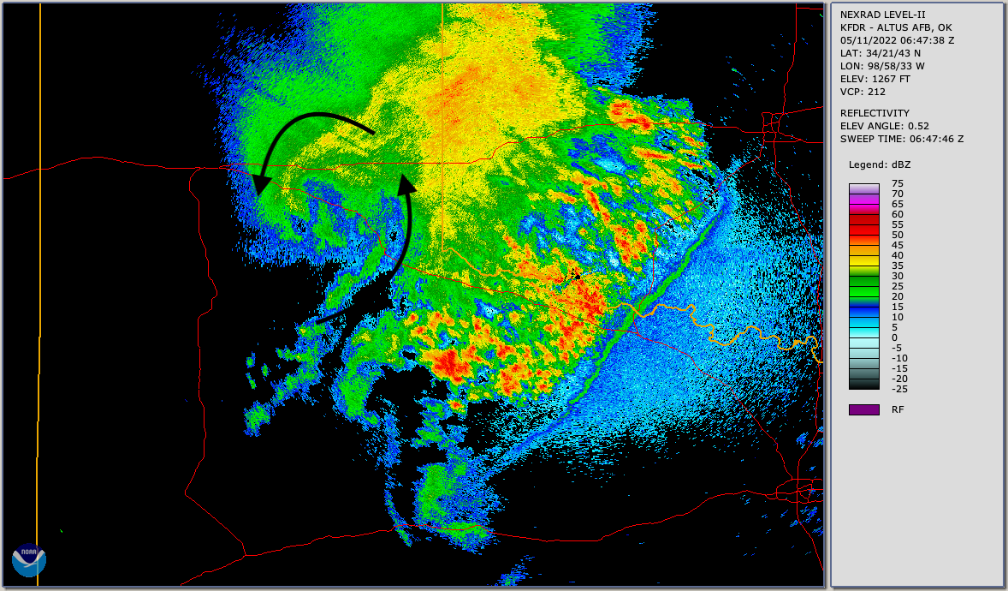
Like a detective, we can follow the trail from the Minneapolis area toward the southwest where we found the linear MCS forming around 2300 UTC (5:00 PM CDT) on May 11 in southwest Minnesota. Further to the southwest, we see an MCV that moved from the Texas panhandle across the plains during the day to northeast South Dakota by late afternoon. We can track the origin of the MCV back to the overnight hours of May 10-11 at 0647 UTC (1:47 AM CDT) in the Texas panhandle. The Altus, OK AFB base reflectivity radar image shows the MCS and evidence for the MCV circulation over the Texas panhandle (curved arrows.)
Over the subsequent 16 hours, the MCV travelled more than 600 miles (approx. 1000 km) from its origin in Texas to southeast South Dakota! The MCV and subsequent MCS/squall line/bow echo tracks are shown in red and yellow, respectively, on the following map.
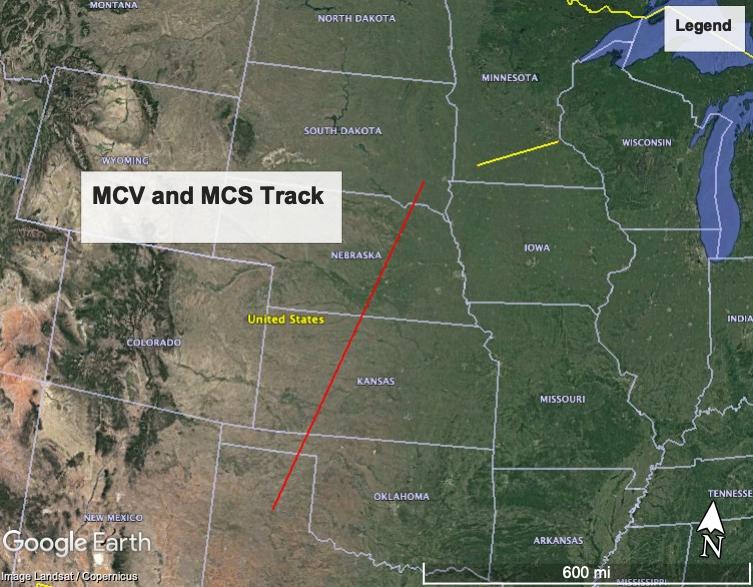
Courtesy of Google Earth
The NOAA Storm Prediction Center (SPC) drew the following diagram representing the positions of the MCV, warm front, and ongoing thunderstorms at 2250 UTC (5:50 PM CDT) 11 May 2022.

Courtesy of the NOAA Storm Prediction Center
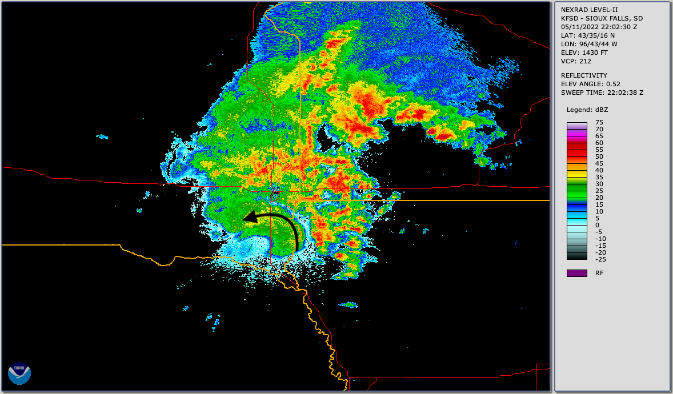
At about 2200 UTC (5:00 PM CDT) a large area of disorganized thunderstorms on the northeast quadrant of the MCV was evident over southwest Minnesota (image on left.) The curved black arrow in the image on the left shows the circulation. In the hour between 2200 and 2300 UTC (5:00-6:00 PM CDT), the storms organized into a squall line – a Quasi-Linear Convective System (QLCS) – indicated by white arrow in the image on the right.

The storms marched eastward at an average speed of 60 mph. A rear inflow jet created a bulge in the line, and by 0134 UTC (8:34 PM CDT), a classic bow structure was captured on the base reflectivity image.

Storm Reports and Data
Storm reports show evidence of a “triple threat” across south central Minnesota including tornadoes, wind, and hail.

The NOAA SPC Storm Reports show 5 tornadoes reported in Minnesota on May 11, two of which were rated EF0. Numerous reports of hail over 1 inch were recorded, 2 reports of 2-inch diameter hail.
Winds along the gust front varied. Two reports in the 70s mph (79 and 77 mph) were recorded near Morristown and Shakopee, MN. There were at least 6 wind reports at 60-69 mph in Minnesota. Further east, a 47-mph gust was recorded at 8:25 PM CDT in Lakeville, MN on the author’s home weather station. It is interesting that the winds leading up to the peak gust were easterlies (not shown) and gradually increased with the approach of the squall line. Winds then rapidly declined after the 47-mph peak northwesterly gust.

Summary
Our interest in the weather led us to examine the very noticeable bow echo looking for its history and precursors. In this instance, mesoscale features had a far-ranging and large-scale impact. We may marvel at the local; but when we connect the local to a broader reality, the result can sometimes be even more impressive.
Acknowledgements
The authors wish to thank fellow Weather Band member, Tom May, for providing additional resources related to this weather event. We are also grateful to the AMS for allowing us the opportunity to share our observations and analysis. We thank the NOAA National Weather Service and the National Corporation for Atmospheric Research (NCAR) for making the BAMEX report accessible to the public. We also gratefully acknowledge the NOAA National Centers for Environmental Information (NCEI) for making radar images available through the NOAA Weather and Climate Toolkit.