Weather and Death on Mount Everest: Part II
- By G.W.K. Moore and John L. Semple
- Jul 31, 2023
Following on from Part I of Weather and Death on Everest, there follows here an indepth look at the meteorological foundations of the storm and the resulting physiological effects on the mountaineers
Analyzing the Into Thin Air Storm
From the 8th to the 13th of May 1996, the summit temperature on Mount Everest underwent an approximate 10°C drop. This transition showed a change from anomalously warm to anomalously cold temperatures. Temperatures remained low until approximately 25 May when they returned to values seen in early May. During this same time, the summit wind speed time series indicates the presence of several distinct maxima, followed by minima that occur with a period of approximately 1 week. One of these maxima occurred on the 9th when wind speeds at the summit were approximately 22 meters per second. The wind speeds decreased over the next 2 days to approximately 15 meters per second before increasing to values in excess of 25 meters per second on the 12th. Wind speeds on the 12th exceeded those observed in 95% of the years in the reanalysis record.
The summit pressure was anomalously high in early May and then decreased over the next 8 days, reaching anomalously low values on 12 and 13 May. The pressure remained low for the next 10 days before returning to anomalously high values around 25 May. With regard to potential vorticity, we see that a transition from tropospheric values (<1 PVU) to stratospheric values (>1 PVU) occurred between 8 and 10 May. The potential vorticity remained high for approximately 3 days before returning to lower values. There were two additional events later in May when high values of potential vorticity occurred.
Considering the spatial representation of the synoptic-scale flow during the Into Thin Air storm, motion in the upper troposphere, where the summit of Mount Everest is located, is quasi adiabatic and occurs, to first order, along surfaces of constant potential temperature (Hoskins et al. 1985). The flow is perhaps best represented on the 340-K potential temperature surface in order to visualize the large-scale circulation during this event (Fig. 1).
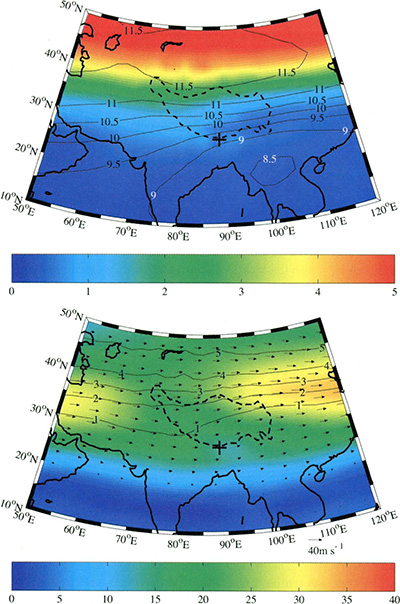 Fig. 1 Spatial structure of the climatological mean (a) geopotential height (contours, km), potential vorticity (shading, PVU), and (b) potential vorticity (contours, PVU) and horizontal wind (vectors, meters per sec.) and wind speed (shading, meters per sec.) fields on the 340-K potential temperature surface during May. Climatology based on the ERA-40 reanalysis for the period of 1958-2002. The 4,000-m height contour is indicated with the dashed line, while the + indicates the location of Mount Everest.
Figure 2 shows the climatology on this surface during May for the period of 1958-2002. With regard to the climatological mean height of this surface, we see that Mount Everest is situated in the region of large meridional gradient as one moves northward from the Tropics toward the midlatitudes. The height of this surface in the vicinity of Mount Everest during May is approximately 9.25 km. From the climatological mean potential vorticity on this surface, it is clear that the summit of Mount Everest is typically in the troposphere with the tropopause just to the north over central Tibet. This confirms that Mount Everest lies in the middleworld (see Part I). From the climatological mean wind speeds on this surface, one can see that the region of high wind speeds known as the subtropical jet stream is typically situated just to the north of Mount Everest during May. The region of low wind speeds in this jet stream over Tibet was first noted by Krishnamurti (1961). 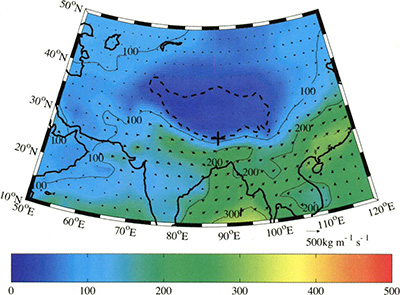
Fig. 2 Spatial structure of the climatological mean vertically integrated moisture transport field (vectors, kg m-1 s-1) and its magnitude (contours and shading, kg m-1 s-1) during May. Climatology based on the ERA-40 reanalysis for the period of 1958-2002. The 4,000-m height contour is indicated with the dashed line, while the + indicates the location of Mount Everest.
During May there are two main moisture streams in the region—the dominant stream that transports moisture in a northeasterly direction over the Bay of Bengal toward southeast Asia, and a weaker stream that transports moisture eastward from the Arabian Sea over northern India south of the Himalayas. There appears to be some convergence effects associated with the high topography of Tibet and the merging of the two streams over northeast India and Bangladesh, which receives the heaviest rainfall on the subcontinent during May.
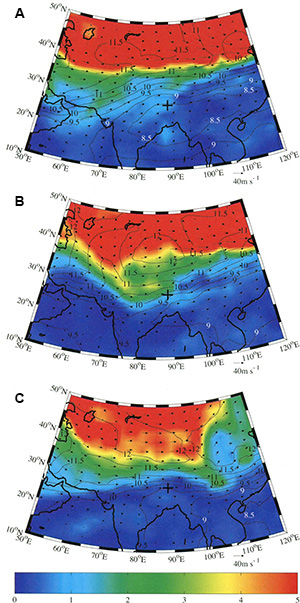 Fig. 3 Spatial structure of the geopotential height (contours, km), the potential vorticity (shading, PVU), and the horizontal wind (vectors, s-1) fields on the 340-K potential temperature surface on (a) 7 May, (b) 11 May,
and (c) 15 May 1996. All fields are from the ERA-40 reanalysis. The + indicates the location of Mount Everest.
Figs. 3 and 4 show the spatial distribution of the potential vorticity, height, and wind speed in the 340-K potential temperature surface before, during, and after the event. On 7 May (Figs. 3a and 4a), the height of this surface in the vicinity of Mount Everest was approximately 8.5 km, which is lower than the climatological value of approximately 9.25 km (Fig. 1a). This reflects the higher pressures that were occurring near the summit. At this time, Mount Everest was situated in the troposphere with potential vorticities in its vicinity less than 1 PVU. The wind speed field (Fig. 4a) clearly shows the presence of a jet streak just to the north of Mount Everest with its entrance region to the west of Mount Everest.
During the storm of 11 May (Figs. 3b and 4b), the height of the 340-K surface in the vicinity of Mount Everest was approximately 10 km, reflecting that lower pressures that were present near the summit. This lower pressure was associated with an upper-level shortwave trough that was situated just to the west of Mount Everest at this time. High potential vorticity was also elevated, and the source of this can be seen from Figs. 3b and 4b to be a filamentary intrusion of high potential vorticity air that extended from the midlatitudes toward the Mount Everest region. Such intrusions are favored in northwesterly flow behind shortwave troughs. Evidence of this intrusion and the associated shortwave trough can be seen, albeit in a weaker form, over the Arabian Sea on the 7th (Figs. 3a and 4a).
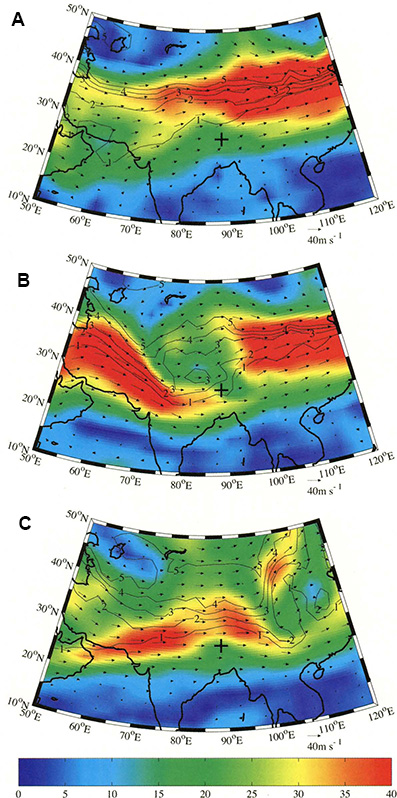 Fig. 4 Spatial structure of the potential vorticity (contours, PVU) and horizontal wind (vectors, m s-1) and wind speed (shading, m s-1) fields on the 340-K potential temperature surface on (a) 7 May, (b) 11 May, and (c) 15 May 1996. All fields are from the ERA-40 reanalysis. The + indicates the location
of Mount Everest.
Two jet streaks were also in the vicinity of Mount Everest on 11 May (Fig. 4b). In addition to the jet streak present on 7 May (Fig. 3a), another jet streak was situated to the west of Mount Everest on the 11th. As a result of its eastward propagation, the entrance region of the jet streak identified in Fig. 3a was now situated to the northeast of Mount Everest, while the exit region of the second jet streak was to the southwest.
Over the next several days, the shortwave trough and the filamentary intrusion of high potential air moved to the east and continued to intensify into a well-defined tropopause fold by the 15th (Figs. 3c and 4c). On this date, Mount Everest was again situated in the troposphere with the 340-K surface being at a height of 9.5 km, close to the climatological value of 9.25 km. The second jet streak that was situated to the west of Mount Everest on the 11th was now situated to its north resulting in the high winds that were observed near the summit in the aftermath of the storm.
The synoptic situation presented in Figs. 3 and 4 provides an explanation for the observations of the people who witnessed strong winds on 9 May (associated with the eastern jet streak), a weakening of these winds late on the 9th as this streak propagated away from Everest, and then a reintensification of the high winds a few days later as the second jet streak passed by. The recollections of those near the summit during the event clearly indicate the presence of high winds in addition to other severe weather elements. Dickenson (1999), who was attempting to summit via the North Col-North Ridge route and as a result was in a more exposed position vis-a-vis the westerly wind, comments on the sustained high winds that occurred after the outbreak of hazardous weather. The winds rendered it impossible for him to summit until they weakened later in the month.
The positioning of these two streaks and the trough was such that the transverse ageostrophic circulation associated with them resulted in a synoptic-scale rising motion near Mount Everest. In addition, there was in the lower troposphere an anomalously large transport of water vapor from both the Arabian Sea and the Bay of Bengal into the region to the south of Mount Everest that was oriented approximately perpendicular to the jet streaks. It is likely that it was the juxtaposition of the ageostrophic circulation associated with these upper-level features near Mount Everest that combined with the anomalous availability of moisture to trigger organized convective activity (Fig. 5). The harsh weather occurred in the late afternoon, and it is likely that this synoptically forced rising motion was enhanced by that associated with the diurnal cycle of solar heating. 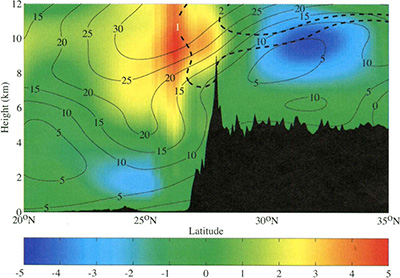
Fig. 5 Cross section of the vertical
velocity (shading, cm s-1) and the zonal
wind speed (solid contours, m s-1) and
potential vorticity (dashed contours,
PVU) though Mount Everest along
87°E on 11 May 1996. All
fields are from the ERA-40 reanalysis.
Please note that the topography along
the cross section does not resolve the
full height of Mount Everest.
These results, along with those of Moore and Semple (see Part I), suggest that it may be possible to use the reanalysis datasets and the models upon which they are based to study and forecast high-impact weather systems in the Mount Everest region, especially in the premonsoon period. This is of great practical benefit because this is the period during which much of the activity on the mountain takes place. As an example, analysis indicates that the 10 May 1996 summit attempt took place during a period in which the pressure at the summit was falling to values that were significantly lower than those usually observed. This signal, which is indicative of large-scale circulation, rather than local wind speed, should have provided a warning as to the possibility of high-impact weather. The analysis of wind speeds as well as the divergent circulation on constant pressure or potential temperature surfaces may provide evidence of the presence of jet streaks, shortwave troughs, and their associated ageostrophic circulations that could assist in determining the potential for harsh weather.
Evidence indicates that fatalities on Everest typically occur during descent and that the probability of death is significantly higher for those not using supplemental oxygen. Operational constraints dictate that descents from the summit of Mount Everest typically occur in the late afternoon or early evening. This, however, is the period of the day when the probability of convective activity is highest over the adjoining plateau (Laing and Fritsch 1993; Yanai and Li 1994). The higher probability of convective activity in the late afternoon when climbers are descending and near exhaustion is another risk factor that has not been previously identified. It is therefore likely that the falling pressure and the high-impact weather that ensues may play a role in the fatalities that occur on Mount Everest. This is especially true above 7,000 m, where climbers are at the limits of their endurance and drops in barometric pressure, when compounded by the accumulative effect of hypoxia, fatigue, high winds, extreme cold, and incomplete acclimatization, could shift a coping climber from a state of brittle tolerance to physiological distress.
How This High-Impact Weather Event Affected the Human Body
It has been well established that the hypoxia caused by the low barometric pressures at extreme altitudes may severely limit human performance. Observations from the summit of Mount Everest indicate that the amount of oxygen in the blood stream is much lower than normal; with an inspired partial pressure of O2 (PO2) of 57 mb compared with a sea level value of 198 mb (West et al. 1983b). Furthermore, above 7,000 m extreme hyperventilation is required to provide even these low values of PO2. This amount of oxygen is barely sufficient for the requirements to maintain even the basal metabolic rate of a human being (West 2000). This has led to many physiological studies that have examined what capabilities mountaineers still have while in this severe hypoxic state. One of the conclusions reached was that the available oxygen levels at these extreme altitudes were exquisitely sensitive to even small variations in barometric pressure.
From the South Col observations of the May 1998 storm discussed by Moore and Semple (2004) as well as this analysis of the Into Thin Air storm, it is clear that pressure fluctuations are associated with the onset of high-impact weather in the Mount Everest region. The Into Thin Air storm was associated with an approximate 8-mb drop in the barometric pressure at the summit of Mount Everest in the ERA-40 reanalysis. This drop in pressure was most likely associated with the presence of the shortwave trough. By comparing reanalyses for the May 1998 storm (see Part I), Moore and Semple (2004) that the size of the pressure drop was underestimated by approximately 40% in the data. This error was attributed to the fact that the reanalyses did not capture the pressure fluctuations associated with the convective component of the high-impact weather. A similar result is probably true for this event as well.
Assuming similar conditions to the 1998 storm, we estimate that climbers trapped above the South Col would have experienced a total pressure drop between 10 and 14 mb during the Into Thin Air storm. Such a drop in barometric pressure would result in an approximate 6% reduction in inspired partial PO2 near the summit (West et al. 1983b; West 1999). Nonlinearities in the relationship between PO2 and maximum oxygen uptake result in an approximate 14% reduction in the amount of oxygen available for climbers near the summit (West 1999).
To put these values into context, similar drops in barometric pressure, PO2, and maximum oxygen uptake, are estimated to occur between summer and winter near the summit of Mount Everest. These reductions are of physiological significance, and according to some investigators are probably why Everest has never been climbed during midwinter without supplemental oxygen. In view of these findings even strong, experienced climbers who were caught near the summit of Everest in a storm of this magnitude would be at a physiological disadvantage. For those climbers without supplemental oxygen or those who perhaps were only partially acclimatized after running out of supplemental oxygen, the physiological impact of the barometric pressure drop associated with such a storm would have been most profound.
In addition, there is evidence for the possible presence of ozone-rich stratospheric air on the upper slopes of Everest during the Into Thin Air storm. A similar conclusion was reached by Moore and Semple (2004). Ozone is recognized as posing a risk to human health as it impairs lung function when present at elevated levels. In this regard, it is interesting to note that exposure to elevated ozone concentrations at moderate altitudes (2434 m) in the Austrian Alps has been postulated to result in a decrease in pulmonary function in mountain guides (Wittels et al. 1997). Furthermore, ozone of stratospheric origin associated with tropopause folds has been measured in commercial aircraft for over 40 years at concentrations that can exceed the air quality guidelines (National Research Council 2002; Spengler and Wilson 2003; Spengler et al. 2004). Indeed, concentrations of ozone in tropopause folds of the type that were associated with the Into Thin Air storm are in the range of 120- 280 ppb. At these concentrations, which exceed guidelines established by the U.S. Environmental Protection Agency and other agencies, it seems reasonable to suggest that the presence of ozone near the summit of Mount Everest represents a previously unrecognized risk to climber's health
