Deadly Weather During the Race to the South Pole
- By AMS Staff
- Jan 24, 2022
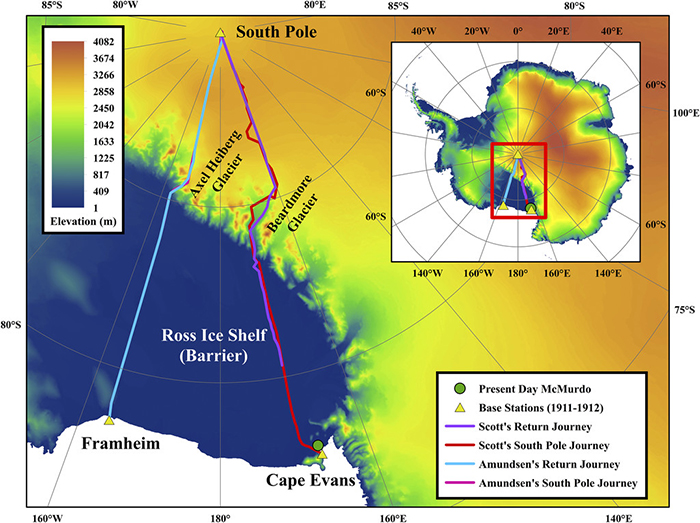
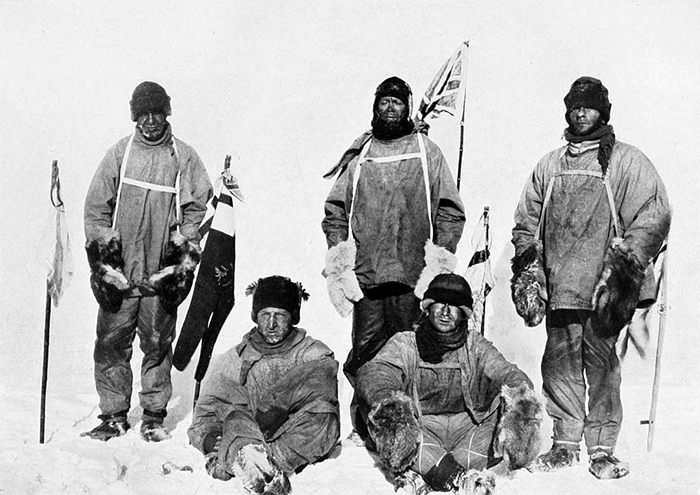
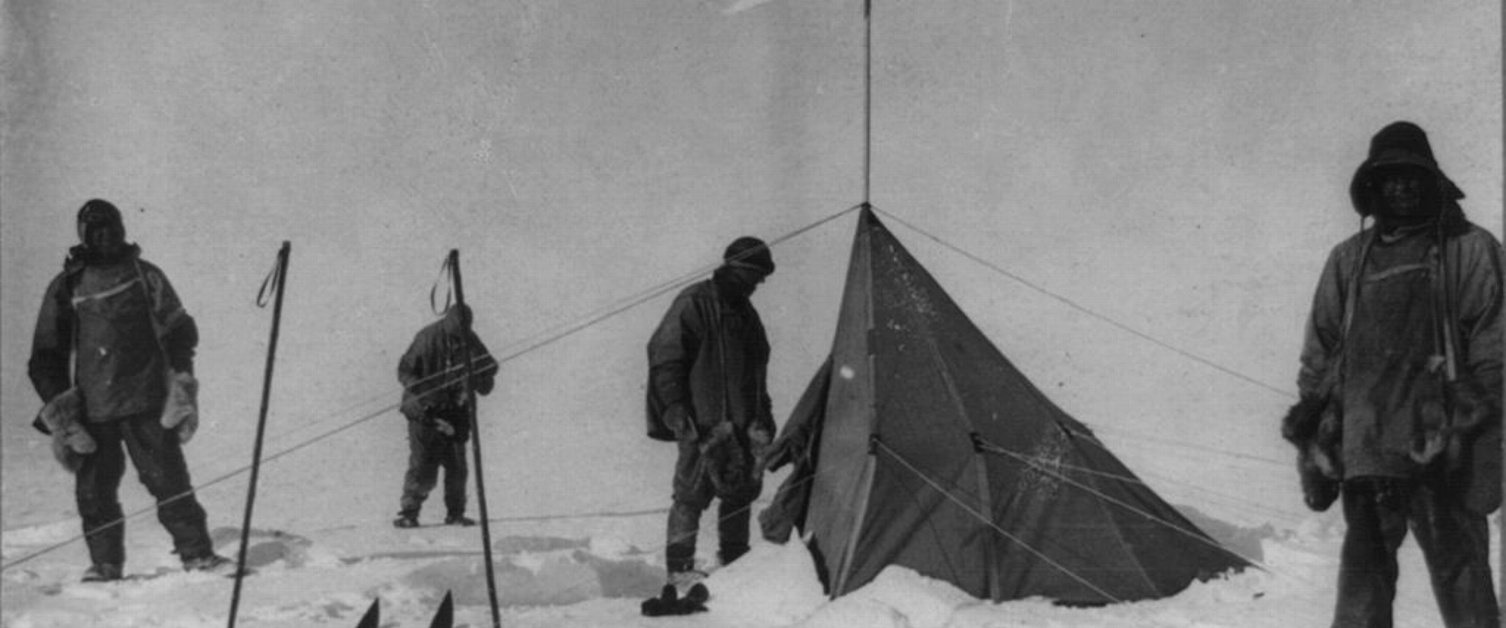
The Norwegian and British Antarctic expeditions to the South Pole are often regarded as the height of the heroic age of Antarctic exploration. Using a team of five men and primarily relying on dog sledges, Roald Amundsen first reached the geographic South Pole on 14 December 1911. Just over a month later, a team of five men led by Captain Robert Falcon Scott reached the South Pole on 17 January 1912, only to find a tent left by Amundsen. While Amundsen and the remaining crew at the main Norwegian base at Framheim were able to safely leave the Antarctic continent in late February 1912, Scott and his four companions, who primarily man-hauled their sledges and supplies, unfortunately perished on their return journey to their main base of Cape Evans on Ross Island. The image below shows the routes of each polar expedition, as well as the location of their main bases.

Both teams kept meteorological logs of the weather conditions at their main bases and at least daily measurements made by various sledging parties, containing primarily pressure and temperature data. In particular, the extensive analysis of the observations by British meteorologist George Simpson provides substantial insight into the conditions faced by the teams. Using these data in comparison with contemporary automatic weather station (AWS) data on the Ross Ice Shelf (called the “Barrier” by both polar parties), Solomon and Stearns (1999) and Solomon (2001) concluded that the weather in March 1912, when Scott and his two remaining companions perished, was much colder and persistent than average and was a primary cause of their tragic end.
But the atmospheric pressure and associated temperature conditions throughout much of early December 1911 and late February and March 1912 were also exceptional across the location of the South Pole race and likely across much of Antarctica. This places an even more dramatic change in the weather coming down from the south polar plateau to the Ross Ice Shelf and therefore might have also caused these cold spells that Scott’s party encountered to seem even more intense. Leaving aside the leadership styles and other factors that led to the vastly different outcomes between the Norwegian and British Antarctic South Pole expedition, the pressure and temperature conditions during the journey to the pole in December for both polar parties and back in February and March for Scott were unique in many aspects.
 At their peak on 6 December 1911, the temperatures measured by Amundsen exceeded -16°C, which represents an anomaly of more than 10°C. Amundsen’s sledging temperature measurements during this time are much warmer than the hourly and daily mean observations collected at the South Pole station since 1957, even when accounting for the average differences in temperature between Amundsen’s location and the South Pole, which is often colder than nearby areas as a result of pooling of cold air in the slightly lower elevation (Comiso 2000). The daily mean temperature measured at the South Pole on 7 December 2015 of -19.8°C (maximum hourly temperature of –18.2°C) is the only comparable warm day before 11 December; otherwise, observed South Pole daily mean temperatures had never exceeded -20°C in this portion of early summer. In contrast, Amundsen experienced 4 continuous days with daily mean temperatures exceeding -19.0°C. At the onset of this warm weather on 5 December 1911, Amundsen noted that “there was a gale from the north, and once more the whole plain was a mass of drifting snow. In addition to this there was thick falling snow, which blinded us and made things worse, but a feeling of security had come over us and helped us to advance rapidly and without hesitation, although we could see nothing” (Amundsen 1913, p. 107).
The blizzard-like warm weather continued on through 8 December, when it finally gave way to clearer and calmer conditions. At this time, Amundsen reflects on the warmer conditions, writing “The weather had improved, and kept on improving all the time. It was now almost perfectly calm, radiantly clear, and, under the circumstances, quite summer-like: –0.4°F [–17.5°C]. Inside the tent it was quite sultry. This was more than we expected” (Amundsen 1913, p. 115). Later, on that same day, he further noted, “The warmth of the past few days seemed to have matured our frost-sores, and we presented an awful appearance” (Amundsen 1913, p. 116). Little did he and his companions know that these “summer like” conditions in early December 1911 were exceptionally warm, even though this region frequently experiences warm-air intrusions from the Ross Ice Shelf (Hogan 1997).
Although not as exceptional, Scott’s party also experienced warm conditions during 5–8 December 1911 (Fig. 3b), when he and his team were on the Ross Ice Shelf. As for the Amundsen polar party, the warm conditions experienced by the British expedition at this same time were also accompanied with a blizzard on the Ross Ice Shelf, which kept them immobile during the 5–8 December 1911 period. In contrast to the relative dryness of the high plateau, conditions on the Ross Ice Shelf can be wet when flow conditions allow an influx of relatively warmer marine air. During this time, Edward Wilson, the doctor in the British polar party, frequently mentions in his journal the warm, wet conditions, with heavy wet snow, as noted on 8 December 1911: “We woke up to the same blizzard blowing from the S. and S.E. with warm wet snow +33 (°F) [0.56°C]. All three days frightfully deep and wet…It has been a phenomenal warm wet blizzard different to, and longer than, any I have seen before with excessive snowfall” (Wilson 1972, p. 212).
Even though both polar parties spent some time on the polar plateau in January 1912, where temperature–pressure relationships are stronger (Fig. ES8), owing to the much smaller pressure anomalies at this time at Cape Evans and Framheim, it is not too surprising to see both parties observe colder-than-average temperatures (Figs. 4a and 4b). Because of the reduced temperature variability in January, these below-average temperature anomalies rarely are lower than –5°C and are generally smaller than the positive anomalies in early December 1911. Further, while a few of the colder temperature measurements for each party in January 1912 were abnormal, the two parties never simultaneously observed persistent strong cold spells, unlike the warm spell in early December discussed previously (Fig. 4c).
When the pressure measurements at Cape Evans become exceptionally high again in early February 1912 (Fig. 3a), conditions changed for Scott’s party, and persistent above-average temperature anomalies were recorded again on the polar plateau (Fig. 4b). Similar to the blizzard conditions in early December he encountered on the Ross Ice Shelf, Scott makes frequent note of these warm conditions at the top of the Beardmore Glacier, providing further evidence that they were exceptionally warm. When the daily mean temperature anomalies were the highest on 9 and 10 February 1912, Scott writes “Very warm on march and we are all pretty tired. To-night it is wonderfully calm and warm, though it has been overcast all the afternoon” (Huxley 1913, p. 389) on 9 February, and “snow drove in our faces with northerly wind-very warm and impossible to steer, so camped…The ice crystals that first fell this afternoon were very large. Now the sky is clearer overhead, the temperature has fallen slightly, and the crystals are minute” (Huxley 1913, p. 390).
Although the temperatures fell slightly on the evening of 10 February, they remained warm until 14 February. Notably, Scott makes no further mention of the warmer weather and instead writes more on the crevassed conditions, finding the next depot, and the failing health of seaman Evans. However, during these unusually warm days, Scott’s team slowed their pace, spending time collecting geologic specimens. They failed to reach a key life-saving supply depot by only about 12 miles when Scott’s party died a few weeks later, and it is plausible that they may have survived if they had not slowed down on these days. The unusual warmth of early February, consistent with the timing of exceptionally high pressures at Cape Evans and Framheim (Fig. 3a), may have contributed to that choice.

These much-warmer-than-average temperatures in early February were followed by unusually cold conditions in late February and March 1912. It should be noted that the sling thermometer used by Bowers, who collected the meteorological observations for the Scott polar party, broke on 10 March; the instrument and method used for later data noted by Scott in his diary are unknown and those data are not examined here. Examining all available sling thermometer temperature anomalies from the various sledging parties, including the Dog Sledge party, the Motor Sledge party, and the First Relief party (who were sent to find and attempt to rescue Scott and his companions if needed in March 1912), the general pattern of a warmer-than-average December 1911 emerges (especially early December), and the warmer-than-average conditions experienced by Scott in early February also stand out as exceptional; these temperature anomalies are overall consistent with the exceptionally high pressure anomalies throughout December and again in early February recorded at Cape Evans.
The cold spell experienced by Scott in late February and March 1912 has been discussed as an element that led to the weakening of several members of the Scott polar party and played a role in their fate (Solomon and Stearns 1999). Despite Scott writing that “no one in the world would have expected the temperatures and surfaces which we encountered at this time of year” (Huxley 1913, p. 416) in his letter to the public, it was likely not the cold temperatures per se, but rather their persistence, that played a role in their demise, as argued by Solomon (2001). However, the change in temperature anomalies from early to late February, associated with the tail end of the exceptionally high pressures at Cape Evans (Fig. 3a), is nonetheless exceptional. In only one year during 1979–2015 was there a similar large swing in temperatures on these days. Such a difference, based on the approximate normal distribution of the data in Fig. 5, has a miniscule probability of occurring in any given year, highlighting that the change from a warm early February to a cold late February was exceptionally rare. As such, this unique and dramatic change would have undoubtedly caused the colder temperatures experienced soon after on the Barrier to be perceived as even colder, perhaps justifying the surprise that Scott conveyed in his letter to the public about these cold conditions.
While several studies have focused on the unusually cold conditions Scott and his companions experienced in March 1912 (Solomon and Stearns 1999; Solomon 2001), many aspects of the summer of 1911/12 were also exceptional in terms of the meteorological conditions. In particular, Amundsen’s polar party observed temperature anomalies in excess of 10°C (an absolute daily mean temperature of –15.5°C) on the plateau in their approach to the South Pole; comparable warmth has only once been observed in over 60 years of temperature measurements during 1–10 December at the Amundsen–Scott South Pole station. At the same time, Scott experienced warmer-than-average temperatures as well while on the Barrier, with warm wet snow that delayed their journey several days. While both temperature and pressure remained below to near average in January 1912, Scott experienced much-warmer-than-average conditions on the descent down the Beardmore Glacier in early February, followed by much-colder-than-average temperatures on the Ross Ice Shelf in early March.
The period of warmth, consistent with another period of exceptionally high pressures at Cape Evans, may have lulled Scott’s party into slowing down, and it is possible that they would have reached their key next depot if they had not done so. Although temperatures naturally turn colder at this time of year with the onset of winter, over 30 years of data indicate that during 1979–2015, the temperatures rarely changed as sharply as Scott and his men experienced. Reconstructions of the pressure at individual stations across Antarctica, as well as early SAM index reconstructions, further indicate that the summer of 1911/12 was marked by one of the strongest negative SAM years since 1850. Notably, the summer of 1911/12 was also marked with El Niño conditions in the tropical Pacific (reflected to some extent by the Southern Oscillation pattern in Fig. 2c), and other research suggests that the combination of El Niño events with negative SAM phases act to amplify the atmospheric response across the Pacific sector of Antarctica (L’Heureux and Thompson 2006; Fogt et al. 2011). It was therefore likely that the combination of these two climate patterns gave rise to the overall exceptional summer during the South Pole race, which makes this incredible story even more of a legend.
This article has been adapted specifically for the AMS Weather Band from the longer article “An Exceptional Summer during the South Pole Race of 1911/12” by Ryan L. Fogt, Megan E. Jones, Susan Solomon, Julie M. Jones, and Chad A. Goergens. Any errors and omissions may be attributed to AMS staff. Copyright remains with the AMS
