A Full Cargo of Data
- By AMS Staff
- Jun 6, 2023
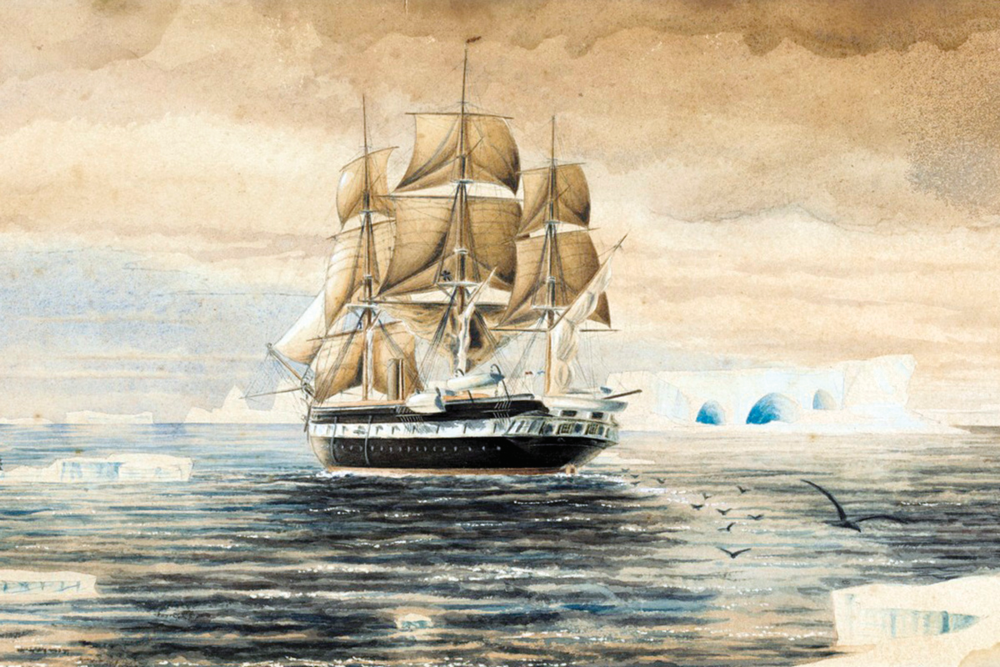
Ship image courtesy Gillen D’Arcy Wood
1872–76 — The years that the research ship HMS Challenger sailed the world’s oceans and collected oceanographic information. Those data are now available on a new website (https://challenger-expedition.sams.ac.uk/) that was established by Gillen D’Arcy Wood of the University of Illinois Urbana-Champaign as part of his Oceans 1876 project commemorating the 150th anniversary of the Challenger’s launch. On its journey, the ship traveled 70,000 miles and collected data from more than 360 research stations, including information on currents, water temperatures, conditions, and chemistry. Scientists on the Challenger also collected plant and animal specimens, discovering thousands of new species in the process. Over a 20-year period that followed, marine researchers published dozens of volumes of reports on the data. Wood, who calls the Challenger expedition “the foundation for modern marine science and oceanography” and “the grand prize of scientific voyages,” started his Oceans 1876 project so that scientists today can compare their work to historical records. “There’s more interest in eighteenth- and nineteenth-century discovery voyages because they established a data baseline for various ecosystems around the world,” Wood says. “The records they kept, the specimens they gathered, and their observations are vital for creating a snapshot of the preindustrial world. It’s like a time capsule of what the Earth was like 150 years ago.” [Source: University of Illinois Urbana-Champaign]
.png)
The website includes an interactive map that provides information about data collected during the Challenger’s stops at each research station worldwide. Users can select a location to see the air and water temperatures and water density recorded and the species found, and read the log entry for that location.
Map image courtesy Fangyu Zhou/NCSA
* For more content from the Bulletin of the American Meteorological Society, please click here.