Weather in a Pen Stroke
- By Robert Houze and Rebecca Houze
- Dec 30, 2020
The Role of Cloud and Weather Symbols in Historic Hand Plotting
Before today’s technology was available, skilled technicians plotted cloud and atmospheric observations on weather maps by hand. New observations arrived over telegraph or Teletype, and the plotter would create a new map each time. The information arrived in an alphanumeric code, and the plotter would have to decode and record the correct data at the location of each station. The information had to be entered quickly in order for the plotted map to be current. It also had to be entered in a universally accepted format, and it had to be legible so that the analyst could use the plotted map.
Of course the plotters had to record numerical information on wind, temperature, humidity, and pressure at each station. But descriptive information from visual observations of sky and weather at each site could not be entered numerically. Instead, they drew ingeniously simple symbols to represent the visual information at each observation point on the map. These symbols facilitated fast plotting and efficient representation of complex descriptive information about the weather. Despite the speed with which they can be rendered, the design of these small symbols has a surprisingly rich history.
Is a Cloud Symbol Science or Art?
Long before airplanes and satellites, clouds dominated the human perception of the sky and stood at the center of the early nineteenth century’s convergence of art and science. Poetry as well as visual art was part of this movement, as can be seen in Johann Wolfgang von Goethe’s (1749–1832) poem “In Honor of Howard.” This poem muses about how human imaginations roam free when looking at clouds in the sky:
Here lions threat, there elephants will range,
And camel-necks to vapoury dragons change.
Goethe’s title refers to the English pharmacist and amateur meteorologist Luke Howard (1772–1864), who, in 1803, suggested a set of symbols that could signify three fundamental cloud forms through simple line drawings: a diagonal line for cirrus, a semicircular curve for cumulus, and a horizontal bar for stratus. These simple strokes of a pen efficiently convey the complexities that Goethe sought to describe.
Later in the nineteenth century, three other key figures in cloud study emerged. These were the Scottish meteorologist Ralph Abercromby (1842–97), the Swedish physicist Hugo Hildebrand Hildebrandsson (1838–1925), and the English clergyman and early meteorologist William Clement Ley (1840–96).
All three realized the importance of connecting pictures of clouds with their names and symbolic representations. Abercromby (1887) wrote of “the impossibility of expressing the varying forms of clouds in words.” It was becoming obvious that clouds took so many different forms that Howard’s three symbols were not enough. In an 1894 treatise called Cloudland, Ley (1894) elaborated on Howard’s three basic cloud-form symbols and suggested a large number of variations and hybrid symbols. One combination of these shapes, for example, was the use of small concave downward curved lines above a horizontal bar, to represent stratus castellatus (or what we now call altocumulus castellanus). Three quick strokes of the pen created the unmistakable form of a turreted medieval castle or city wall.
For both Howard and Ley, these imaginative, visually meaningful but simple-to-execute cloud symbols were vital. They not only described the condition of the skies, but also created a visual depiction of how the sky varied across expansive weather maps. In this way they could collect information over a vast geographical territory, and extend the reach of what could be observed by a single set of eyes in one location at a given moment.
Creating the Cloud Atlas
In the late nineteenth century, Ley, Abercromby, and Hildebrandsson saw the potential power of photography and became advocates of using photographs of clouds to relate to names and symbols. Photography could capture the transient nature of clouds much more efficiently than sketching and painting. But in these early days of photography it was still difficult to capture the changing forms of clouds on glass plates. As a result, early cloud atlases had to rely on combining photographs with hand-illustrations to guide naming.

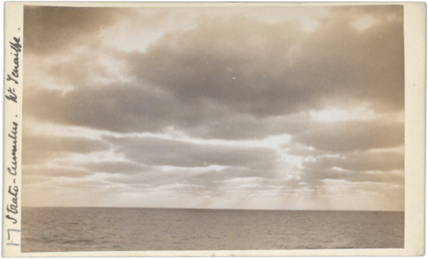
An example from Ralph Abercromby’s collection of photos that he took on his around-the-world tour documenting clouds at diverse locations. This example taken at Tenerife in the Canary Islands shows stratocumulus clouds over the subtropical ocean. Photo: Met Office Library Archives.
After trying unsuccessfully to collect cloud pictures from other people, Abercromby spent a decade traveling around the world taking pictures of clouds. From this he decided that an international system of cloud identification was necessary because “cloud forms are the same all over the world”—a fact we now take for granted, but which was not known at that time. In the course of his travels he “had the opportunity of conversing with the Directors of many Meteorological Institutes in various parts of the world, and…found that though some forms of cloud were almost universally assigned the same name, others—especially the lower clouds—received a different name from nearly every Director.” He declared, “The question of an International Nomenclature of Clouds becomes of the highest importance.”
Hildebrandsson shared Abercromby’s opinion that a naming system for cloud types was needed. Along with Wladimir Köppen (1846–1940) and Georg Balthazar von Neumayer (1826–1909), Hildebrandsson published Wolken-Atlas, an early picture atlas of cloud types (Hildebrandsson et al. 1890). But even though Abercromby had created his collection of cloud pictures, this atlas was primarily a portfolio of full-page paintings of each of the basic cloud types. Hildebrandsson used only a few small black and white photos to accompany his text.

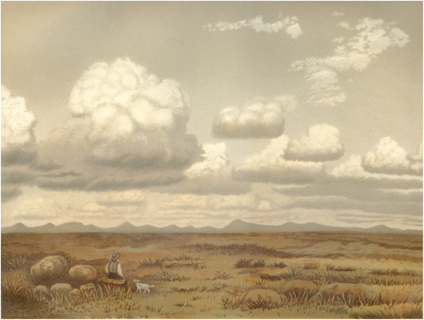
Illustration of cumulus cloud in the cloud atlas of Hildebrandsson et al. (1890, plate 8).
But technology was rapidly developing, and photographs of clouds soon replaced paintings. In 1896, Hildebrandsson, working with Swiss meteorologist Albert Riggenbach (1854–1921) and French meteorologist Léon Teisserenc de Bort (1845–1918), produced the first mostly photographic International Cloud Atlas (Hildebrandsson et al. 1896). This atlas was notable for its inclusion of chromotypographs of certain types of clouds. Chromotypographs were an early way of printing with colored inks. These chromotypographs were forerunners of the high-quality color photographs used in today’s online International Cloud Atlas.
From Photo to Symbol
The creation of cloud atlases in the 1890s took place at the same time that European and American scientists were trying to standardize meteorological observations. They wanted to do this to map and track weather events across international borders. The first international conference on these matters was in Brussels in 1853, and one important topic was agreement on shared codes and symbols for observed clouds (Pouncy 2003). A later conference, held in Vienna in 1873, resulted in the formation of the International Meteorological Organization (IMO), the forerunner of the World Meteorological Organization (WMO).
In 1891 in Munich, the IMO held another conference, where a very long and intense discussion was devoted to the identification of clouds. When brought to a vote, “The resolution of the Conference, carried by a large majority, was to adopt the classification of clouds, with 10 grades, proposed by Prof. Hildebrandsson and Mr. Ralph Abercromby.” A committee was then formed to follow up with the task of forming a cloud atlas “to introduce uniformity in the classification and nomenclature of cloud observations.”
That committee’s work resulted in the 1896 version of the International Cloud Atlas (Hildebrandsson et al. 1896). This outcome was probably the most important step in establishing the 10 basic cloud types still in use today. The IMO and WMO have updated the atlas many times since 1896, but always with 10 basic cloud types. The 2017 revision of the WMO’s International Cloud Atlas is available online (https://cloudatlas.wmo.int/). Its 10 basic cloud types still fall into the categories identified by Abercromby and Hildebrandsson, although a few have different names now.
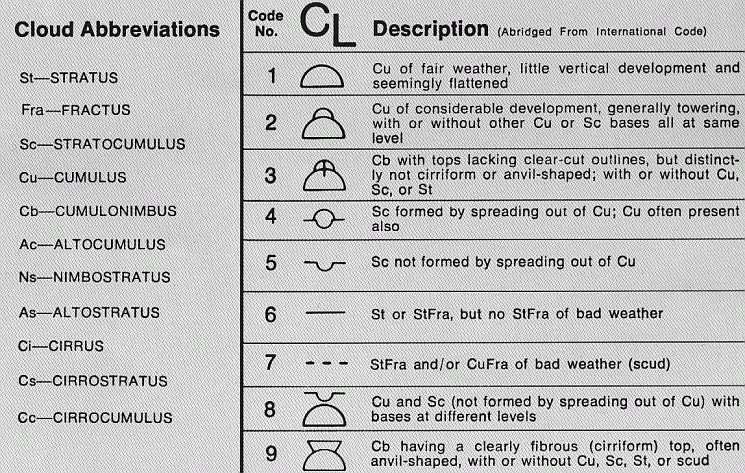
The 10 basic cloud types identified by Abercromby and Hildebrandsson occur in a variety of structural variations and hybrid forms. The 10 basic types can be expanded into 27 specific and frequently observed combinations, each of which can be drawn on maps by a specific symbol. The 27 varieties are also subdivided into three groups of 9 specific cloud types considered to be low, middle, or high, where the heights are those of the bases of the clouds. These categories have been institutionalized, standardized, and illustrated by the International Cloud Atlas and the WMO “Manual of codes” (WMO 2017) with little modification since the early 1900s.

An example of modern cloud symbols from NOAA
What About the Weather?
Besides the state of the sky overhead, reports from meteorological stations include other information about the experience of atmospheric conditions on the ground or on the deck of a ship at sea. Like clouds, these conditions cannot always be simply expressed as numbers. The conditions at Earth’s surface, as opposed to the sky overhead, are what meteorologists classify as “weather.” These conditions include rain, snow, hail, drizzle, fog, sleet, lightning, haze, smoke, blowing dust, snow, and several variants of these phenomena. They represent the diverse ways that the atmosphere affects us as we go about the business of our daily lives.
Meteorologists have been thinking about how to represent these conditions on a map for more than two centuries, and the symbols we use today, like the symbols for clouds overhead, have undergone an evolution. Interestingly, while cloud iconography was influenced by visual art, weather symbols have had a rather different history, seemingly influenced more by technology than art. In contrast to the cloud symbols, which took the form of abstract shapes reminiscent of naturalistic yet complex cloud forms, the weather symbols have been built largely on the nonalphabetic elements of writing, such as punctuation marks, which became increasingly standardized in the development of different typefaces used for printing.
Three decades before Luke Howard introduced the elemental cloud symbols, the Swiss scientist Johann Heinrich Lambert (1728–77) suggested the basic elements of weather symbols. They comprised simple lines, apostrophes, x marks, dots, and a zigzag form attempting to represent clouds, rain, snow, fog, and thunder. These minimalist marks recalled complex phenomena and were the seeds from which modern symbols have evolved. The x marks representing snow and the zigzag representing thunder (often associated with a lightning stroke) are clear progenitors of the modern symbols in which an asterisk is used for snow and various zigzags are used for different forms of thunder and lightning. In their shorthand notation, they expressed not only the practice of handwriting, but also the new technologies of writing and printing in a world increasingly defined by industrial mechanical reproduction and the quick transmission of information.
Where Are They Now?
The era of hand-plotted weather maps began to decline in the mid-1960s, as meteorology was becoming more technological and complex. The delightful, artistic and clever symbols for the clouds seen from Earth’s surface discussed above have now fallen into disuse. They have not been printed on the Daily Weather Map since the year 2000. Advances in models, satellite data, physical understanding, and measurement techniques have led to great successes in weather forecasting, warnings of extreme events, and climate assessment over the last century.
But along with this march of technology, weather maps may have lost some ability to convey the everyday human experience of weather. The disappearance of the qualitative observations represented by symbols at individual weather stations has made it more difficult to assess from a map how the clouds and weather are affecting people looking out the window and up at the sky. Meteorology is an important part of the human experience, and losing the art of weather map plotting has implications that affect our ongoing understanding of the human condition. Dropping the cloud symbols from the Daily Weather Map has removed useful information about the sky overhead. Fortunately, the weather symbols have been retained and access to the Daily Weather Map is available online. This access is important for maintaining the ability to understand, record, and appreciate the experience of the natural world.
This article is edited and abridged for the AMS Weather Band from the original “Cloud and Weather Symbols in the Historic Language of Weather Map Plotters” by Robert A. Houze Jr. and Rebecca Houze. Any errors of grammar, syntax, etc. may be attributed to AMS Staff.
