Ranking Tornado Outbreaks
- By AMS Staff
- Jan 27, 2022
As part of his presentation at the 2022 AMS Community and Citizen Science Symposium, Rick Haltermon asked that we include the following project summary and link to his data. Enjoy!
Project Summary
I was listening to the WeatherBrains podcast (Episode 806) and there was a discussing what constitutes a tornado outbreak and the fact that there is not a rigorous definition for the term outbreak. And I am not sure there is a need to define the term for meteorological purposes. But I wondered if I could come up with my own Outbreak Index to allow comparison and ranking of events that might be termed a tornado outbreak.
The Storm Prediction Center has available for download a text file with all tornadoes from 1950 through 2019 (all_tornadoes_1950_2019.csv). I downloaded the file and loaded the data to a MySQL database.
My first attempts to look at the data were just to see how many “neighboring” tornadoes each tornado had. I selected days with 50 or recorded tornadoes and computed the total distance to each neighbor, the total time between the tornado and its neighbor, and the EF rating for all of the neighbors for each of the 60,000+ tornadoes that occurred from 1950 through 2019. I then picked the top ten outbreak days and posted the information the AMS Weather Band forum.
I had some very interesting feedback from the post, including some observations and ideas to think about from Hunter Haugen. After a little more thought I decide to scrap the neighbor methodology and use two different measures.
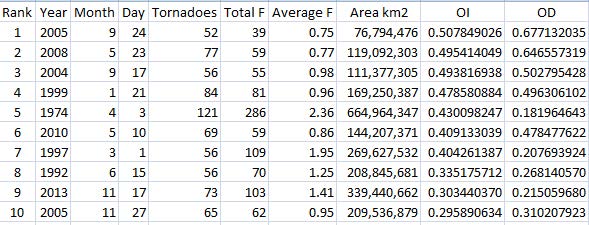
The first is outbreak density (OD) and is calculated by dividing the number of tornadoes by the area of a polygon bounded by the tornadoes. The second is outbreak intensity (OI) which is calculated by dividing the total of EF ratings by the area of a polygon bounded by the tornadoes. Both of the measures units are per billion M2.
I used MySql’s built in function (convex hull) to determine the polygon and the area for each day with 50 or more tornadoes.
I then loaded the polygons and points for the top ten days into a GIS program (QGIS 3.20.2) for the top ten days and created a graphic to each day.
By running this project, I learned a few things.
1) By thinking through what might constitute and outbreak, it made reading the following professional material much more interesting and meaningful.
- PROPOSALS FOR MODERNIZING THE DEFINITIONS OF TORNADO AND SEVERE THUNDERSTORM OUTBREAKS
- What Is a Tornado Outbreak?: Perspectives through Time in: Bulletin of the American Meteorological Society Volume 102 Issue 4
2) Some of tornado outbreaks were associated with hurricane landfall. I had never thought much about the tornado threat imbedded in hurricanes and reading those histories was interesting.
3) I did not use fatality, injury, or dollar loss in the calculations because those values seemed to more a function of where the tornadoes occurred. Although the EF ratings certainly impact those figures.