The Value of Volunteer Observations for Tracking Heavy Rain in Mesoscale Convective Systems
- By Ted Best
- Dec 18, 2020
Photo: Ryan De Hamer
In his book, Cloud Dynamics, Robert Houze quotes Mark Twain’s Huckleberry Finn:
“The fifth night below St. Louis, we had a big storm after midnight, with the power of thunder and lightning, and the rain poured down in a solid sheet.” (Houze, Cloud Dynamics, Academic Press, 1993). The likelihood is that Twain’s story was recounting a common occurrence in the Midwest summer: what we know today as the mesoscale convective system or MCS, a conglomeration of thunderstorms that often reach a peak in the middle of the night.
Although they may generate severe weather, the heavy, and often beneficial rain that they produce is sometimes overlooked. This can be due to inaccuracies with rainfall measurement, but also because of a lack of data. A powerful and accurate way to track MCS rainfall is through volunteer rain gauge networks, most notably COOP (U.S. Cooperative Observer Program) and CoCoRaHS (Community Collaborative Rain, Hail, and Snow network) observers. These gauge networks provide a valuable resource to gain better insight into heavy rain associated with these events. Goble (Goble et al., BAMS, 2020) recognized the value of CoCoRaHS and COOP observations for tracking MCS rainfall extremes among other events.
This study describes a late-summer MCS that occurred in the overnight hours of 05-06 September 2020 and uses volunteer rainfall reports to track the heaviest rain produced by this event.
What is a Mesoscale Convective System?
An MCS is defined as “a cloud system that occurs in connection with an ensemble of thunderstorms and produces a contiguous precipitation area on the order of 100 km or more in horizontal scale in at least one direction” (Glossary of Meteorology, 2nd Ed., American Meteorological Society, 2000). These systems and their larger siblings, mesoscale convective complexes (MCC), take on many forms depending on the environment. These forms have been classified into archetypes or organizational modes, for example, trailing stratiform (TS.) (Parker and Johnson, Mon. Wea. Rev., 2000).
The Events of the September 5-6 MCS
When analyzing the storm of September 5-6, we see a typical archetype for heavy rain, the training line/adjoining stratiform (TL/AS) as defined by Schumacher and Johnson (Schumacher and Johnson, Mon. Wea. Rev., 2005). “Training” refers to movement of successive thunderstorms cells over the same area where heavy rain accumulations result. This event follows a typical synoptic setting for the TL/AS archetype, with a frontal zone (Fig. 1) and associated low-level jet (LLJ) (Fig. 2.)
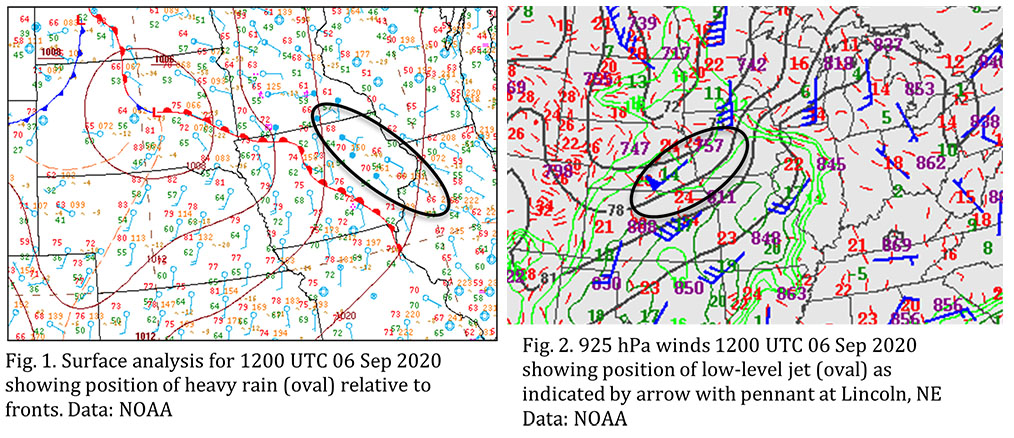
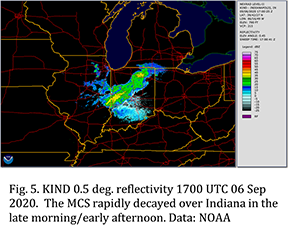
The LLJ is an important feature for heavy rain production because of its ability to supply a continuous flow of moisture to the thunderstorms. The LLJ is evidenced by a 50 kt. wind speed at Lincoln, Nebraska in the 925 hPa analysis (approx. 800 m or 2500 ft. above the surface.) It is not uncommon for these storms to be elevated above the boundary layer on the cool side of a front. Their occurrence shows a bimodal annual distribution with a secondary maximum in September (Coleman, Mon. Wea. Rev., 1990). In this case, storm cells initiated in the late evening over southern Minnesota (Fig. 3) and then gradually organized into an MCS that moved southeast in the overnight hours across northeast Iowa (Fig. 4) and finally decayed during the late morning and early afternoon over central and northern Indiana (Fig. 5.)
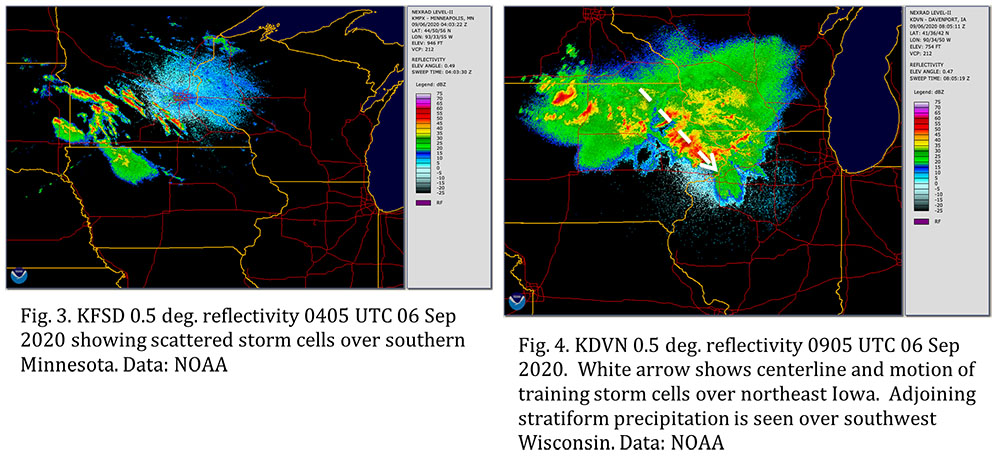
During the overnight hours, cells on the southwest flank of the MCS formed a training line over northeast Iowa with adjoining stratiform precipitation (TL/AS organization) over southwest Wisconsin (Fig. 4.) In Delaware and Buchanan counties (Iowa), where the heaviest rain fell, at least three waves of thunderstorms, some slow moving, can be seen passing over the same area in the radar loop. These cells are visible in Fig. 4. The white arrow depicts their approximate motion.
Tracking Rainfall During an MCS
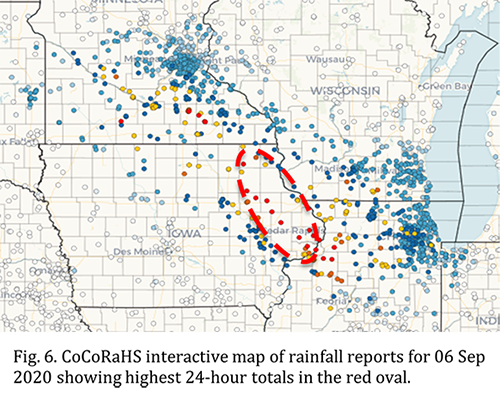
One practical problem with rainfall data is that observers often take measurements at different times, and in volunteer networks, the data is typically measured only once in a 24-hour period. When tracking the rainfall in an MCS, this can lead to differences between reported rainfall on a given day and storm total precipitation. Because of their typical lifespan, MCSs often span two observation periods, so storm totals must be computed as the sum of two observation periods. In this case, the sum of two consecutive periods was representative of the storm total given that no other rainfall, except from the MCS, occurred during either of the two periods.
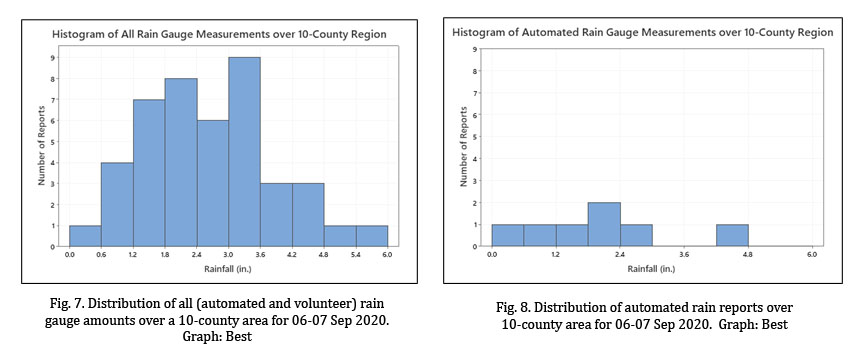
For this study, rainfall observations were sampled over a 10-county area in northeast Iowa where the most intense storms occurred. This area is marked by the red oval in Fig. 6. A total of 43 reports were recorded including volunteer and automated (airport AWOS or ASOS.) The distribution of all reported amounts is shown in Fig. 7. Of the 43 reports, 36 were volunteer observations. To illustrate their value in tracking heavy rain, 17 of the 43 rain reports were over 3 inches, and 16 of the 17 (94%) were volunteer observations. Furthermore, 11 of the 17 (65%) were CoCoRaHS reports. Importantly, without the volunteer observers, most of the heaviest rain and two of the reports over 5 inches would have been missed. Indeed, as the histogram in Fig. 8 shows, a large portion of the rainfall distribution would have been lost. Other than data from remote sensing tools (Doppler radar storm total precipitation), there would be no “ground truth” data to measure the precipitation impact of the MCS. Given the large number of summer MCSs across the central US, this scenario might be repeated many times in a single summer.
In summary, volunteer observers provide valuable rainfall data that can be used for many purposes. In this case, the rainfall produced by an MCS was captured in detail by a network of volunteer observers. The data that they provided allowed a more accurate analysis of the storm system than would have been possible otherwise. This data can be used to expand our understanding of these events, which occur many times in the course of a summer. Further research might focus on rainfall in summer MCSs over a geographic region using rain gauge data to provide a more detailed view of their impacts. If he were here today, even Huck Finn might appreciate the service that volunteer weather observers provide.
