Cloud Tracker: Satellite Imagery and the Pioneering Work of Tetsuya Fujita
- By W. Paul Menzel
- Jun 26, 2023
Today we rely so heavily on satellite imagery for understanding, predicting, and maintaining life-safety in weather, that it's hard to imagine a world without it. But until the 1960s, there was no satellite imagery, let alone the richly colored images of atmospheric movement that we see everyday.
In addition to his well known and groundbreaking work on tornadoes and aviation safety, Tetsuya Theodore (Ted) Fujita was a pioneer in using satellite imagery to understand and analyze atmospheric motion. He created methods for analyzing satellite images that allowed observers to accurately diagnose wind movement using pictures from the early Television Infrared Observation Satellite (TIROS) launches. He also developed laboratory techniques that facilitated cloud motion analysis.
Together with his staff and students, he made numerous investigations of clouds (motion, growth or decay, and height) using observations from the ground, aircraft, and space. These studies contributed to our understanding of how cloud motion measurements relate to the winds in the cloud environment. And his use of geostationary satellites to study cloud motions associated with storms and mesoscale systems provided both research and operational meteorologists with new insights into atmospheric circulations on many scales.
The TIROS Inspiration
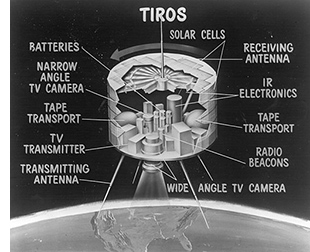 The first weather satellite was the TIROS series, which were launched beginning in 1960. The first satellite was in orbit for only 2 and a half months, but captured around 23,000 photos of the earth. Two television cameras were housed in the craft, one low-resolution and one high-resolution. A magnetic tape recorder for each camera was supplied for storing photographs while the satellite was out of range of the ground station network. The cameras only recorded images of the earth when it was in sunlight, but it still showed proof of concept for the use of satellites to gather weather information. And when viewed in time sequence, these cloud pictures showed the potential for visualizing atmospheric motions.
By developing this time sequence and ways to increase the accuracy of the imagery, Fujita’s methods allowed researchers to use satellite photographs to estimate the speed of both low- and high-level winds that were occurring around the earth. In the study of a 1960 South Pacific tropical storm, Fujita and Uchijima (1963) analyzed clouds to provide information about the direction of low-level winds and the vertical wind shear between 700 and 200 Mb. Fujita also showed how cloud shadows in these early satellite pictures could be used to determine cloud-top height. Thanks to his contributions, the combination of ground and satellite cloud observations is still being used and refined today.
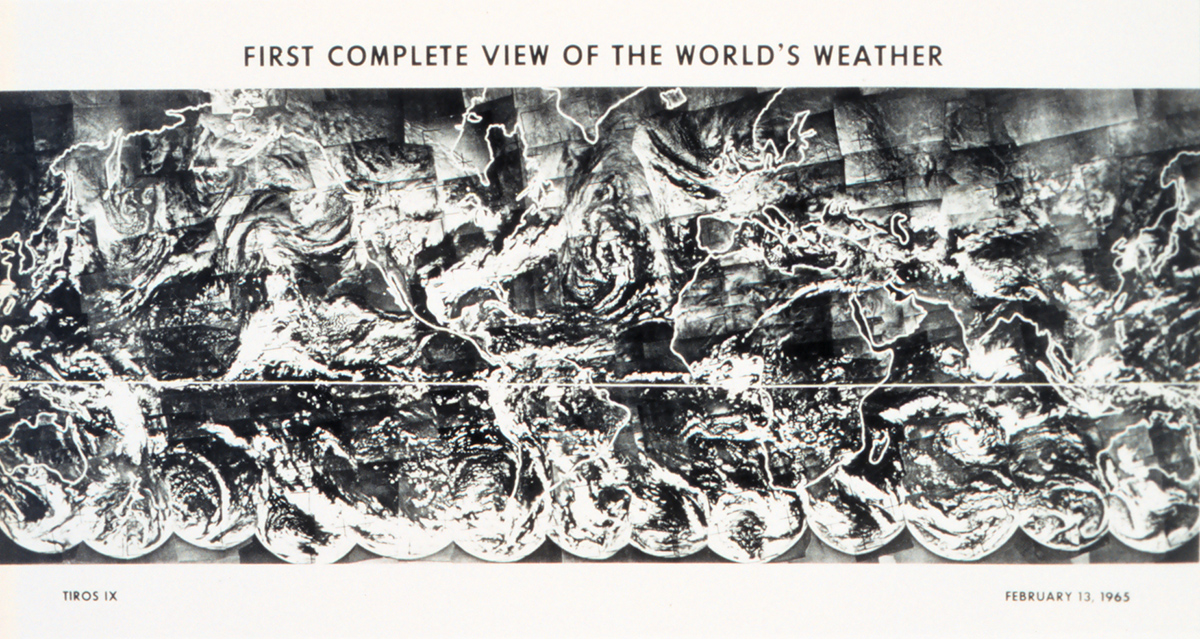
A team of researchers, NASA employees, and what was then ESSA (today NOAA) compiled this view of winds across the Earth from a series of images from the TIROS-IX. Image: NASA
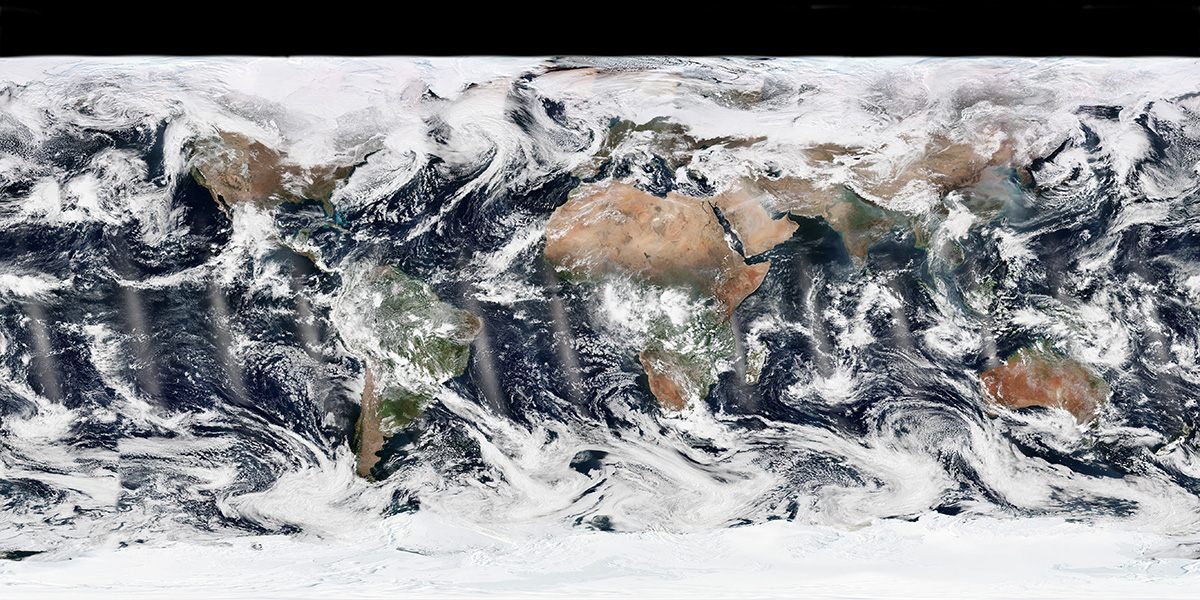
This image shows the same composite as above, this time from NASA's GOES satellites. Compositing is now done by machine, while in the early days of satellite imagery it was all done by hand. Image: NASA
A New Satellite in Town
In addition to creating new methods from the TIROS imagery, Fujita saw potential in a new satellite launch in 1966. This was the Applications Technology Satellite, which ushered in a new field of research: geostationary remote sensing. The ATS-1 spin-scan cloud camera was developed by Professor Vincent Suomi from the University of Wisconsin. It provided full-disk visible images of the earth and its cloud cover every 20 min. Suomi in 1969 noted that now "the clouds move—not the satellite."
Within the first month of the availability of ATS-1 imagery, Fujita and Bohan (1967) produced a movie showing enlarged views of mesoscale cloud patterns in motion. This film was widely shown and provided one of the first demonstrations to the meteorological community of how animated satellite images could reveal atmospheric motion. This, of course, opened up a variety of potential uses for research and operations with animated satellite imagery.
Not stopping there, Fujita also collaborated with Suomi and Parent to produce the first color movie of the Planet Earth using the three different simultaneous spectral images provided by a later satellite, the ATS-III. This movie introduced the sequence animation technique that became the standard for producing movie loops of operational geostationary image.
Building on his work with the images available from the TIROS satellites, Fujita applied cloud motion analysis on ATS data to investigate the formation and structure of atmospheric circulations on all scales. He examined the mesoscale structure of a subtropical jet stream using cloud motion vectors to compute how they moved and what the atmospheric impacts were. Fujita generated a wealth of information about thunderstorms and tornadoes from these imagery analyses, but also used cloud tracking to show how jet stream flow is modified by large convective storms (Fujita 1969b) and the interaction between a jet stream and outflows from a hurricane and large rain areas (Fujita 1969c). These movies and observations not only created new types of imagery, but also contributed new insights into atmospheric behavior.
But Why Stop at Movie Making?
In addition to showcasing new visual techniques, Fujita's methods of analyzing cloud and winds via satellite also contributed to a number of hurricane and tropical cloud studies. He wrote on the use of ATS pictures in hurricane modification, and his studies on the tropical Pacific included the outflow from a tropical cloud cluster and an equatorial anticyclone. In the tropical Atlantic, Fujita tracked Saharan dust and computed cloud motions over the Global Atmospheric Research Program (GARP) Atlantic Tropical Experiment area. It’s difficult to overstate how large of a frontier these satellite images opened up.
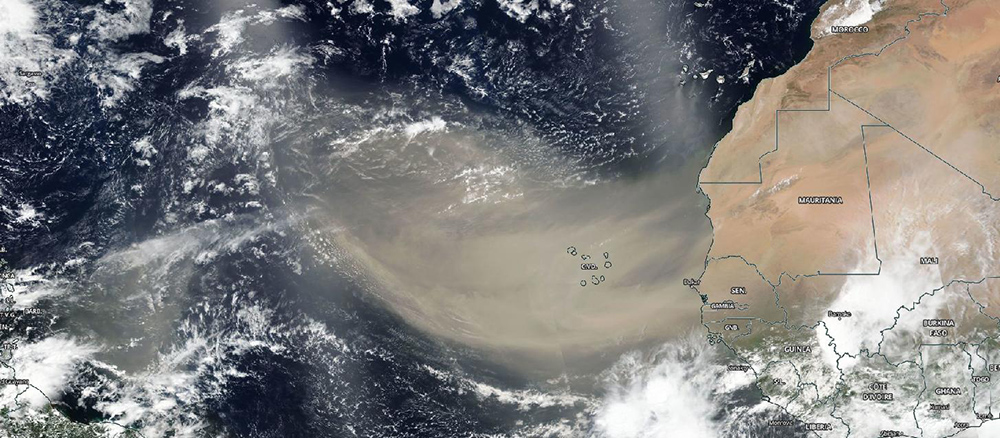
Today, NASA's Suomi-NPP satellite captures highly detailed, color images of the same phenomena that Fujita observed in the 1960s. Here plumes of dust sweep off of the Saharan Desert. Image: NASA
Fujita pursued an understanding of the relationship between cloud motions and the wind with a series of cloud truth experiments during most of his career. The Satellite and Mesometeorology Research Project at the University of Chicago, under Fujita's direction, established a camera network in Hawaii to gather photographic cloud data during the Line Island Experiment in March and April 1967. He developed techniques using ground-based cameras to stereoscopically track cloud features; he inferred velocity and height of clouds from dual-camera whole-sky time-lapse picture sequences. The purpose of Fujita's experiment was to validate the contention that ATS could greatly enhance the efforts to detect atmospheric motions on synoptic scales.
The Importance of Ground Photography
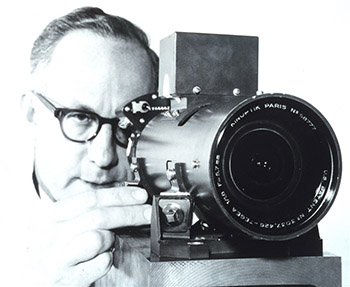 Fujita refined the techniques for tracking clouds and inferring winds using image sequences and validated those satellite cloud motion vectors with the ground cameras. His careful analysis of mesoscale cloud motions from a combination of ATS-1 and terrestrial photographs confirmed that atmospheric motions could be correctly determined from properly navigated geostationary images. Merging information from satellite images and analyses of conventional data, Fujita was able to understand greater detail in the synoptic situation and specifics about the behavior of the wind. (The image here shows adjustment to the TIROS-1 television camera before launch. Image: NOAA)
The combination of Suomi's spin-scan camera and Fujita's cloud tracking techniques opened the door to a new field of understanding atmospheric motions from remotely sensed image sequences. These early efforts (with sequences of images from a geostationary platform) still set the standard for much of modern work into the 2000s.
Fujita also conducted three more cloud truth experiments with ground cameras (Fujita 1992). In Barbados (1967), Cape Hatteras (1988), and Key West (1989), he provided independent measurements of cloud height and motion that could be used for validation of both satellite winds and radiosonde data. This verification of data and technique through the use of photography was critical. By the early 1970s ATS imagery was being used in operational forecast centers, with the first movie loops being used at the National Severe Storm Forecast Center in the spring of 1972 and at the National Hurricane Center later that year.
To display the satellite images for useful and timely analysis, Fujita developed the "Fujita wheel," which consisted of a turntable with registration pins to hold and display pictures. The pictures were registered using punched holes on landmarks and illuminated by a strobe light. When properly adjusted, the analyst saw the clouds in motion; the image sequence was updated by adding the latest and dropping the oldest picture.
Shortly thereafter, Fujita and his staff at Chicago developed the Meteorologists Tracking Computer, an interactive computer system for manual gridding of the pictures and estimating atmospheric velocities from cloud displacements through a sequence of timed satellite images. Many of the techniques and procedures developed by Fujita were later used to make movie loops and to estimate satellite winds operationally. The Man-computer Interactive Data Access System refined the techniques for computer assisted movie loop generation and winds production and enabled subsequent global operational activities.
Changing the Technology to Meet the Need
Fujita did not, however, only create groundbreaking research methods and studies. He also contributed to the technology that generated the satellite images. In the 1970s, Fujita used his experience to advise the National Aeronautics and Space Administration (NASA) on future sensor design characteristics; his recommendations covered horizontal resolution, temporal resolution or picture intervals, and radiance enhancement. In particular, he was concerned that tracers associated with cumulus clouds over land demonstrated a trackable life of only 5-10 minutes. This made rapid-scan pictures necessary for computing these winds (Fujita et al. 1975).
In response to these requested modifications and other needs, the ATS evolved into the Geostationary Operational Environmental Satellite (GOES). The later models of the GOES are, of course, in orbit today. The GOES launch was significant because it made possible the routine tracking of clouds at high resolution, with infrared imagery available for cloud height assignment and nighttime tracking. Cloud motion vectors (CMVs) derived from geostationary satellite imagery became an important data source of meteorological information, especially over the oceans. The early satellite CMV production peaked during the First GARP Global Experiment (FGGE) in 1979. During this experiment, meteorological observations from five geostationary satellites were generated twice daily for the whole year to assist the study of global atmospheric circulations. The advent of water vapor imagery with the first Meteosat in 1978 suggested a further multitude of tracers, some associated with water vapor gradients and not clouds (Eigenwillig and Fischer 1982).
Water vapor images often reveal mid- to upper-tropospheric structure that is not apparent in infrared or visible images. Water vapor motion vectors (WVMVs) were soon derived by tracking features in water vapor imagery. These water vapor winds, along with the low-level cloud drift winds derived from animated visible and infrared window images, have been used to help define atmospheric steering currents that influence weather trajectories, especially in hurricane situations. Both cloud and water vapor motion vectors are now produced operationally.
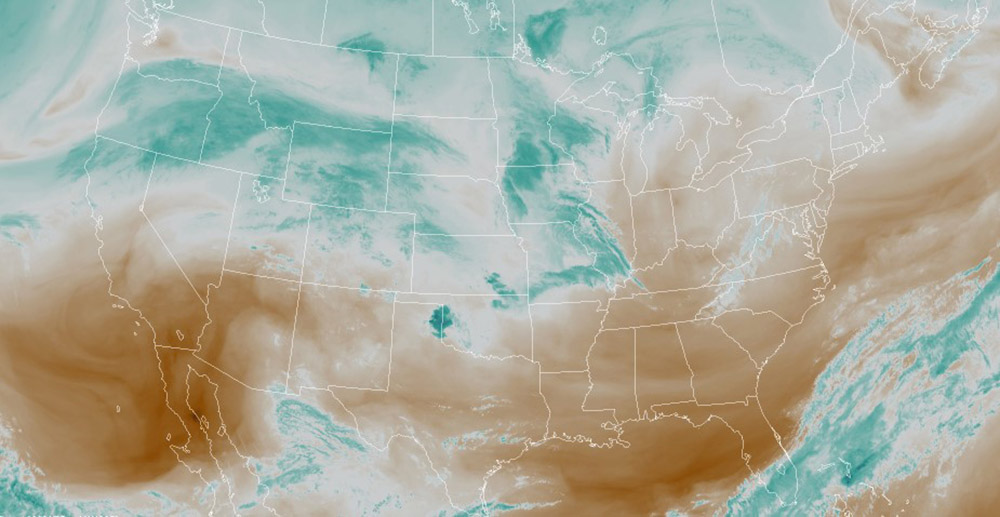
This water vapor map is produced by NOAA's National Environmental Satellite Data and Information Service. Bright blue and white areas indicate the presence of high water vapor or moisture content. Dark orange and brown areas indicate little or no moisture present. Image: NESDIS
Once the two-GOES system became operational, stereo imaging was possible. In 1979 during a project known as the Severe Environmental Storm And Mesoscale Experiment, the two GOES satellites were synchronized to produce 3-min-interval rapid-scan imagery to study storm development. Fujita (1982) used these data to produce very accurate cloud height assignments using stereographic techniques. Results from this and earlier research prompted 5-min-interval imagery to become a routine part of satellite operations during severe storm outbreaks.
Looking back at the great number of studies that Professor Fujita initiated and participated in, two things stand out in particular: what an incredible amount Professor Fujita contributed to the field of meteorology, and how much we now take satellite imagery and analysis for granted. Many of these products and methods from the 1960s are still used in some form today. And we would not have anywhere close to current forecasting capabilities or severe storm warnings without them.
This article has been abridged and adapted specifically for the AMS Weather Band from an original article that appeared in the Bulletin of the American Meteorological Society. Any errors or omissions may be attributed to AMS staff. Copyright remains with the American Meteorological Society.
