Buoy Observations During the 1993 "Storm of the Century"
- cruising
- By David Gilhousen
- Jun 2, 2021
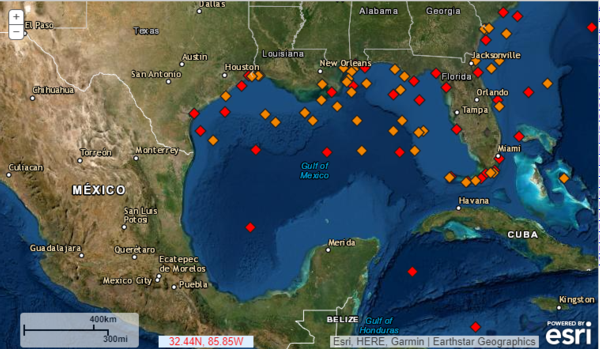
Buoy locations in the Gulf of Mexico. Image from NOAA
Beginning on March 8, 1993, numerical weather prediction (NWP) models consistently predicted a deep winter storm for the eastern United States on March 13. These NWP models gave excellent advance notice and produced accurate forecasts of the storm track location. However, the model runs of March 13 considerably underforecast the deepening of the storm in the northeast Gulf of Mexico. For example, the 36-h Nested Grid Model (NGM) forecast of central pressure valid at 1200 UTC on March 13 (when the storm center was predicted to be in southwest Georgia) was 21 hPa too high! Most of the models that were run showed the storm deepening between 36 and 48 h when the storm was farther north.
These guidance errors led to some problems with public and marine forecasts. Though a coastal flood watch was issued for the Apalachee Bay of northwest Florida, it was not upgraded to a warning until a significant storm surge was in progress. This 11-ft surge resulted in 10 deaths in this remote coastal area. Gale warnings were not upgraded to storm warnings for the central and eastern gulf until the early afternoon of March 12, about an hour before an oil rig at South Marsh Island, Louisiana, reported sustained winds of 93 mph.
Over land, snow accumulated on bridges and overpasses as far south as the Mississippi Gulf Coast and the western Florida Panhandle in the storm’s wake when public forecasts mentioned snowfall only in interior sections of the South. Finally, snowfall amounts were much greater than predicted across northern Alabama, eastern Tennessee, and western North Carolina.
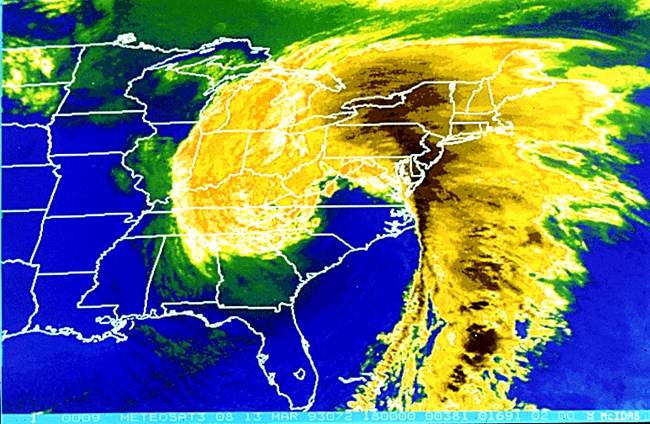
Satellite image of the storm on March 13, 1993
National Data Buoy Center (NDBC) observations from the western Gulf of Mexico provided several early indications of more rapid cyclogenesis on March 12, 1993 than was forecast by numerical weather prediction (NWP) models. Observations demonstrated a closed circulation with gale-force winds shortly after the storm entered the Gulf of Mexico. Ocean wave observations reveal some of the steepest waves NDBC had ever measured, indicating phenomenal wave growth and a high potential for damage to vessels and structures.
In addition to these observations, buoy observations also showed a warm eddy that caused sea surface temperatures (SST) to be several degrees above normal under the track of the storm. This created a strong SST gradient to the north of the Gulf of Mexico. NDBC observations showed the eddy to be somewhat larger and warmer than indicated by the National Hurricane Center analysis of the area from March 9. Buoy station 42019 showed a sea surface temperature of 72.8°F, well above the mean monthly temperature of 67.4°F and the NHC’s March 9 analysis of 69.4°F. These warmer than normal sea surface temperatures provided a strong source of energy for storm intensification.
This event demonstrates the tremendous value of NDBC marine observations for accurately detecting the occurrence and strength of coastal cyclogenesis events. NDBC observations from the western Gulf of Mexico gave several early indications of deeper development than was anticipated by numerical weather prediction (NWP) models. Observed winds showed a closed circulation with sustained speeds of 40 mph at a time when NWP models forecast a less-developed system farther south. This shows the need for forecasters to pay close attention to marine observations near storm centers and revise centrally produced analyses when warranted.
This article has been abridged and edited specifically for the AMS Weather Band. Any errors or omissions can be attributed to AMS Staff. Copyright remains with the AMS